
Image
|
Figure Caption
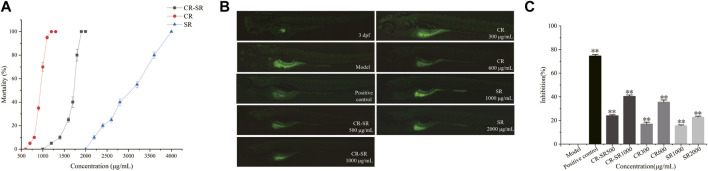
FIGURE 11 Activity of anti-liver cancer in the zebrafish HepG2 xenograft model. (A) Dose–toxicity curves in 3–6 dpf zebrafish. (B) Effects of CR-SR, CR, and SR on the tumor area in zebrafish (×40). (C) Inhibition rates of the CR-SR, CR, and SR groups. **p < 0.01 compared with the model group.
Acknowledgments
This image is the copyrighted work of the attributed author or publisher, and
ZFIN has permission only to display this image to its users.
Additional permissions should be obtained from the applicable author or publisher of the image.
Full text @ Front Pharmacol