
|
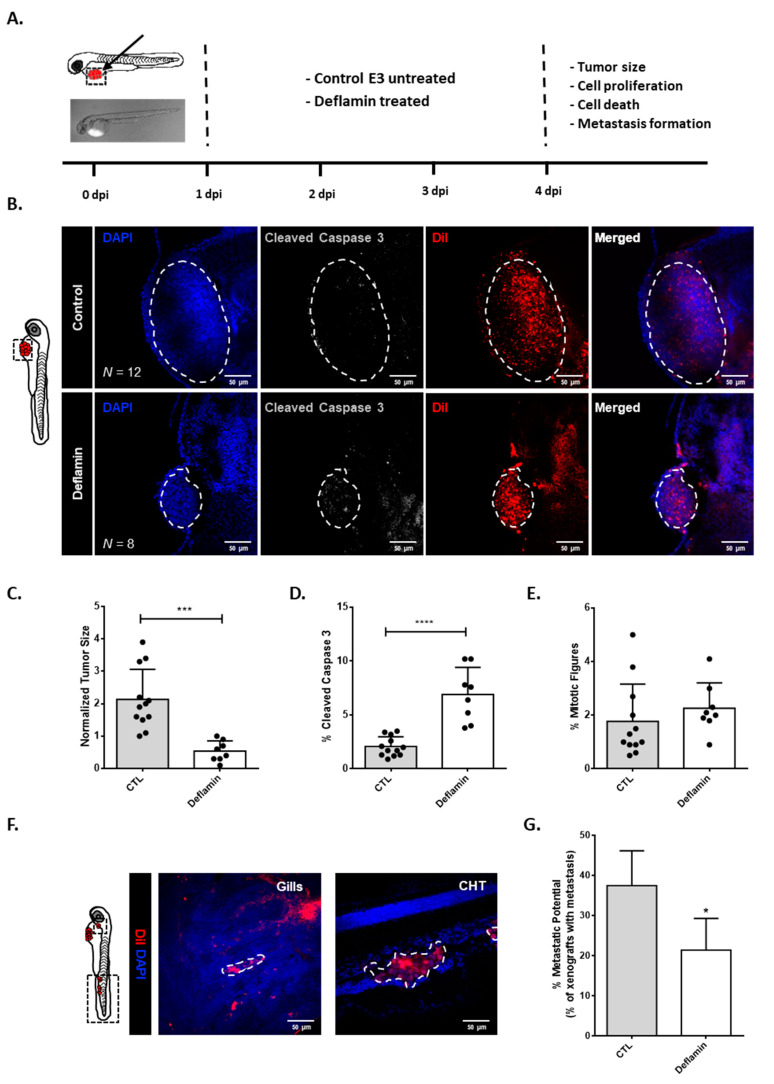
Figure 1
Zebrafish xenotransplant model of HCT116 cells exposed to deflamin: (A) Human cancer cell line HCT116 was fluorescently labeled with DiI (red) and injected into the perivitelline space (PVS) 2 days post-fertilization (dpf) nacre/casper zebrafish larvae. Zebrafish xenografts were treated in vivo with deflamin for 72 h and compared with untreated controls regarding tumor size, cell death, cell proliferation, and metastasis formation; (B) At 4 days post-injection (dpi), zebrafish xenografts were imaged on PVS by confocal microscopy; (C) Analysis of tumor size (***, p ≤ 0.001); (D) Analysis of activated caspase 3 (apoptosis, ****, p ≤ 0.0001); (E) Analysis of mitotic figures (proliferative cells, ns); (F) Zebrafish xenografts were also imaged over the entire body by confocal microscopy. Representative images of HCT116 micrometastasis in gills and caudal hematopoietic tissue (CHT); (G) % of zebrafish exhibiting metastasis. The number of xenografts analyzed is indicated in the representative images. In the graphs, each dot represents one zebrafish xenograft. Statistical analysis was performed as described in the Statistical Analysis section (*, p ≤ 0.05, ***, p ≤ 0.001, ****, p ≤ 0.0001). Scale bars represent 50 μm. All images are anterior to the left, posterior to the right, dorsal up, and ventral down.