
Image
|
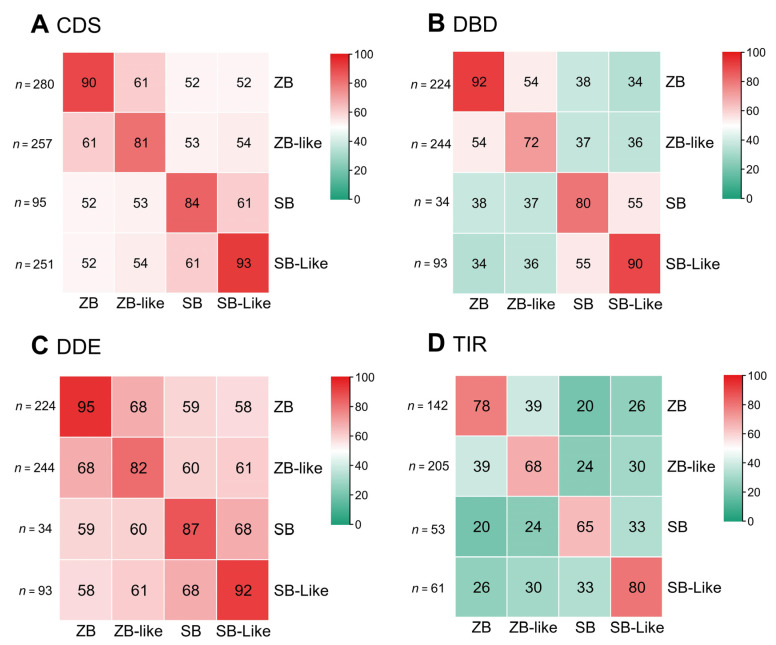
Figure Caption
Figure 2
Sequence identities between ZB and SB elements among species. Sequence identities were measured by pairwise comparison of representative sequences of SB and ZB elements. The numbers in the heatmap are the percentage of the average values of the sequences’ identities of the two types of transposons in the corresponding row and column, and “n” represents the number of each type of transposon sequence (A–D). The average values of sequence identities were measured by pairwise comparison of representative sequences of CDS (A), DBD (B), DDE (C), and TIR (D) of ZB and SB elements.
Acknowledgments
This image is the copyrighted work of the attributed author or publisher, and
ZFIN has permission only to display this image to its users.
Additional permissions should be obtained from the applicable author or publisher of the image.
Full text @ Genes (Basel)