
|
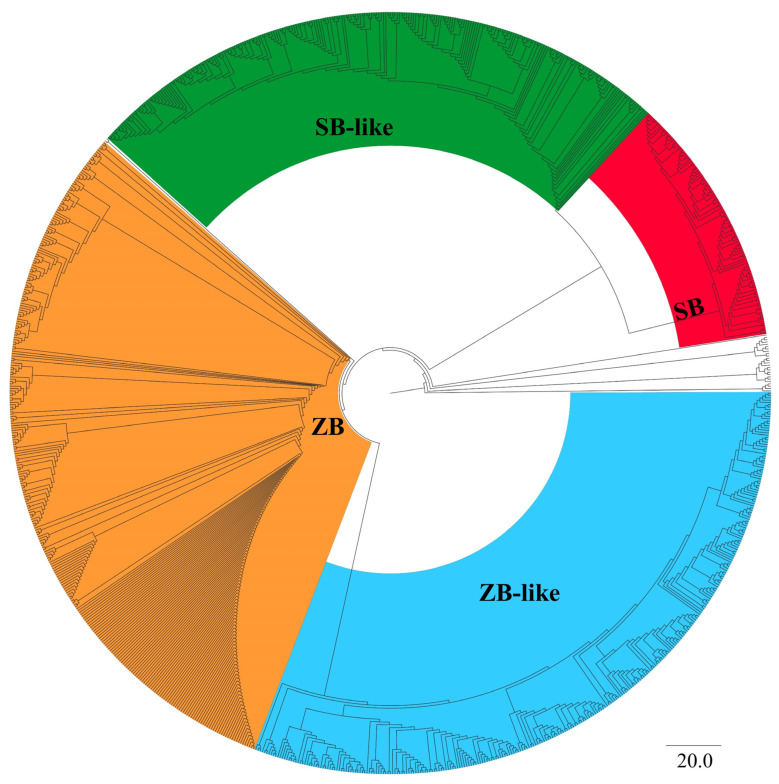
Figure 1
Phylogenetic analysis of SB and ZB elements. Bootstrapped (1000 replicates) phylogenetic trees were inferred using the maximum likelihood method in IQ-TREE (v. 1.6.12) [34]. Reference families were DD34E/Tc1, DD36E/IC, DD37E/TRT, DD41D/VS, DD39D, and DD34D/mariner, DD37D/maT. DD37D/maT was used here as an outgroup. SB and ZB elements form a separate branch individually. The red and green parts in the figure represent the two branches that make-up SB elements, namely cluster SB and cluster SB-like, and the orange and blue parts in the figure represent the two branches that make-up ZB elements, namely cluster ZB and cluster ZB-like, with a confidence level of 100. See Supplementary Figure S1 for details.