
|
Fig. 4
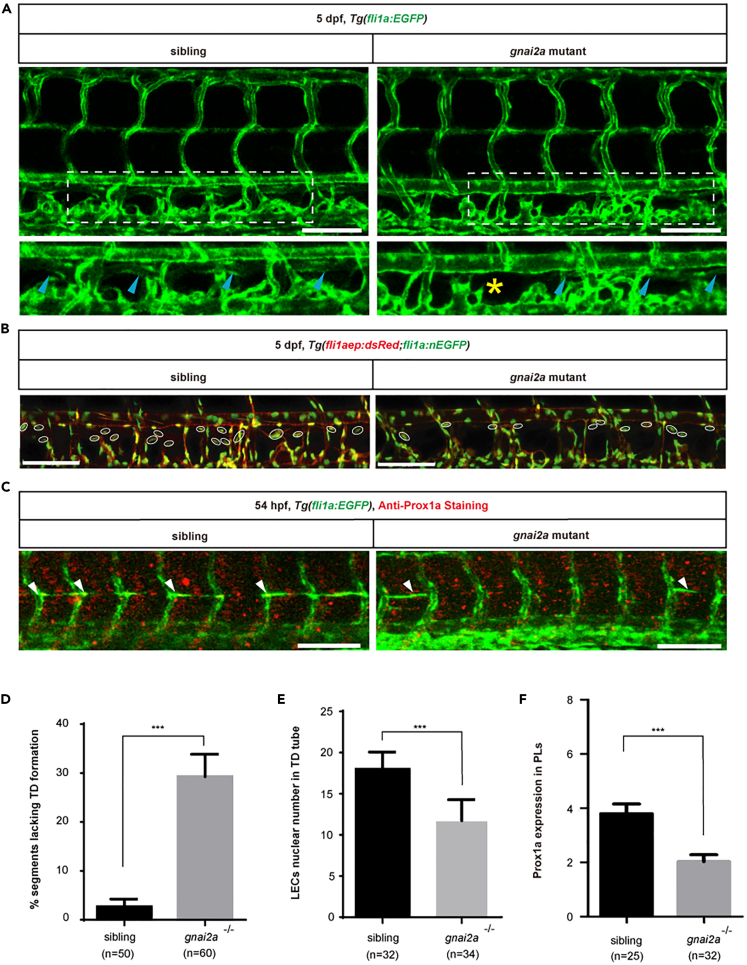
gnai2a mutant mimics the lymphatic phenotypes observed in the par1 mutant
(A) Confocal images showing TD formation in Tg(fli1a:EGFP) siblings and gnai2a homozygous mutants at 5 dpf. Blue arrowheads indicate TD formation in each somite; yellow asterisks represent the absence of TD formation in each somite. Scale bars: 100 μm.
(B) Confocal images showing LECs nuclear numbers in the TD tube of siblings and gnai2a homozygous mutants in the Tg(fli1aep:dsRed;fli1:nEGFP) line at 5 dpf. White circles indicate the presence of LECs nuclear numbers in the TD tube. Scale bars: 100 μm.
(C) Immunostaining of Prox1a of siblings and gnai2a homozygous mutants in the Tg(fli1a:EGFP) line at 54 hpf. White arrowheads indicate positive Prox1a staining in PLs. Scale bars: 100 μm.
(D) Percentage of somites lacking TD formation in siblings (n = 50) and gnai2a homozygous mutants (n = 60 embryos); 6 somites/embryos were used for quantification.
(E) LEC nuclear number in the TD tube of siblings (n = 32) and gnai2a homozygous mutants (n = 34 embryos); 6 somites/embryos were used for quantification.
(F) Prox1a-positive PLs of siblings (n = 25) and gnai2a homozygous mutants (n = 32 embryos) at 54 hpf; 7 somites/embryos were used for quantification. In (D–F), values represent means ± SEMs. ∗p ≤ 0.001 in the Student's t test. See also Figures S2–S4.