
Image
|
Figure Caption
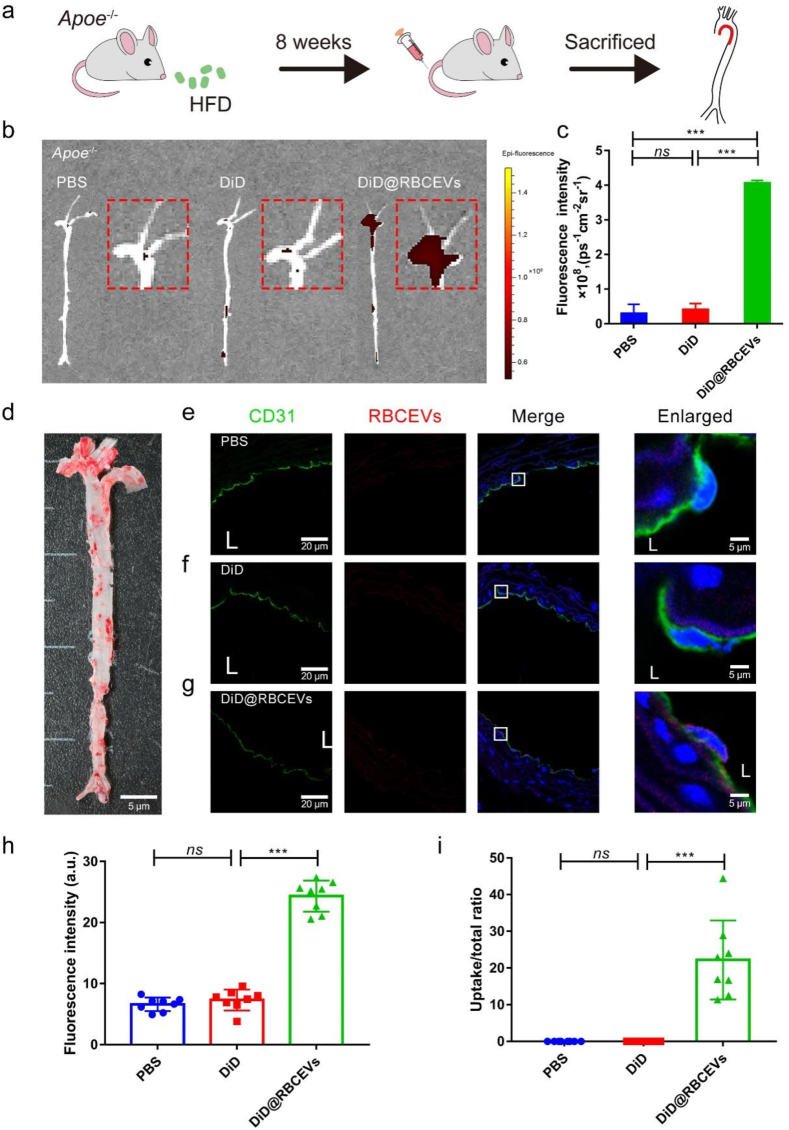
Fig. 6
Uptake of RBCEVs by endothelial cells in Apoe−/− mice. (a) Schematic of Apoe−/- mice. (b) Small animal optical imaging system. (c) Quantitative analysis of (b). (d) Oil Red O Staining on the total aorta. (e) to (g) Laser confocal images in the aorta. The white box indicates that the picture is locally enlarged, as indicated by the white arrow. (h) Quantitative analysis of mean fluorescence intensity and (i) uptake ratio. L: lumen. (n = 8) (scale bar = 20 μm) (scale bar = 5 μm). Significance is indicated as no significance (ns), or P < 0.001 (***).
Acknowledgments
This image is the copyrighted work of the attributed author or publisher, and
ZFIN has permission only to display this image to its users.
Additional permissions should be obtained from the applicable author or publisher of the image.
Full text @ Bioact Mater