
Image
|
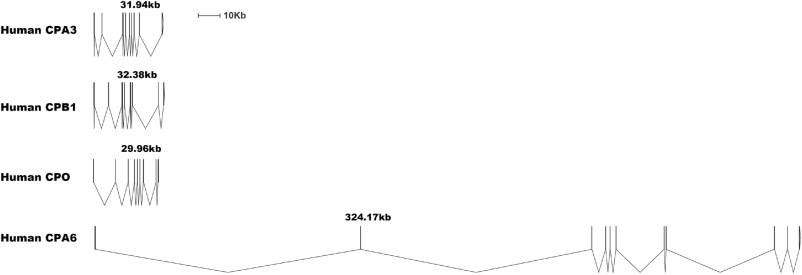
Figure Caption
Fig. 4 Fig. 4. Exon intron structure of human CPA3, CPO, CPB1 and CPA6. This figure is included to show the marked difference in size of these genes and that the size difference depends on difference in size of several of the introns and not on exon size differences. The exons are shown as vertical lines.
Acknowledgments
This image is the copyrighted work of the attributed author or publisher, and
ZFIN has permission only to display this image to its users.
Additional permissions should be obtained from the applicable author or publisher of the image.
Full text @ Dev. Comp. Immunol.