
|
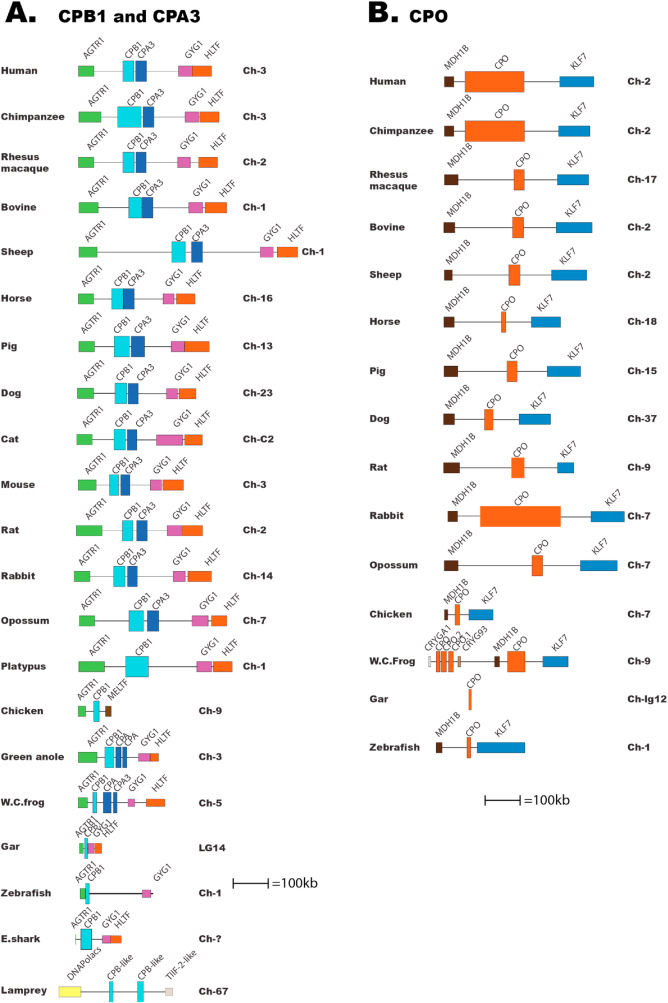
Fig. 1 Fig. 1. The two loci for CPB1 and CPA3 and for CPO. The genes encoding carboxypeptidases are depicted in double-height to easily locate them in the maps. The bordering genes are included to trace the origin of the locus and to also define changes that have occurred upstream or downstream of the locus. Gene names for the carboxypeptidases, as given in the database. Panel A; shows the CPB1-CPA3 locus. The CPB1 genes are depicted in light blue and the CPA3 gene is a slightly darker blue. The bordering genes are shown in different colors to easily distinguish them from each other and from the CPs. Panel B shows the CPO locus. The CPO gene is depicted in Orange.