
Fig. 5
- ID
- ZDB-IMAGE-221220-50
- Publication
- Pereira Sena et al., 2021 - Pathophysiological interplay between O-GlcNAc transferase and the Machado-Joseph disease protein ataxin-3
- All Figures
- Figures for Pereira Sena et al., 2021
|
Fig. 5
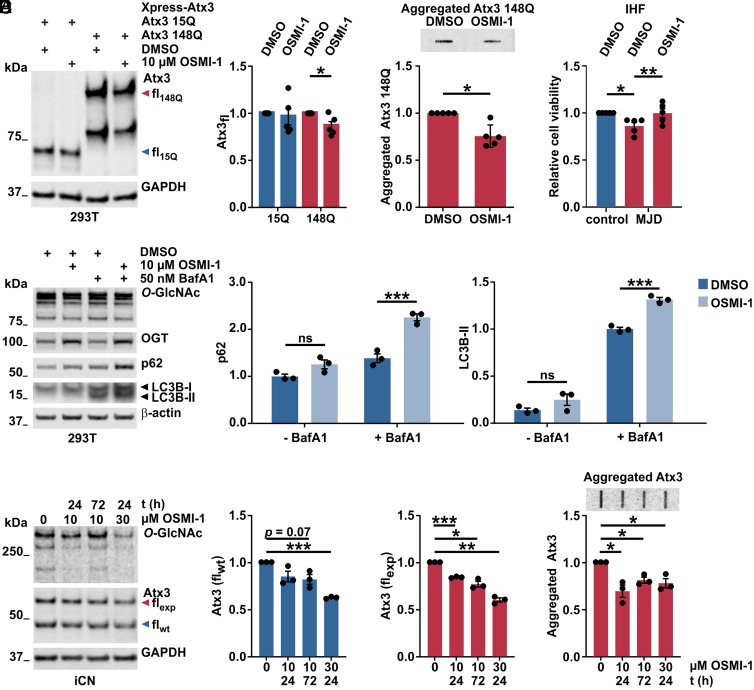
Pharmacological inhibition of OGT reduces polyQ-expanded ataxin-3 levels and aggregates and increases autophagy. (A) Western blot analysis of protein extracts revealing that full-length Atx3 148Q (fl148Q, red arrowhead) was reduced upon OGT inhibition, while Atx3 15Q (fl15Q, blue arrowhead) remained unchanged. GAPDH served as loading control. n = 5 and one-sample t test; in 148Q DMSO versus 148Q OSMI-1, P = 0.044. (B) Filter retardation analysis of samples used in A, showing decreased aggregation of Atx3 148Q upon OSMI-1 treatment. n = 5, one-sample t test, and P = 0.010. (C) Cell-viability analysis of IHF derived from one control and one MJD patient demonstrating impaired viability of the MJD line, which was rescued by a 24 h treatment with 10 μM OSMI-1. n = 5, control DMSO versus control MJD, one-sample t test, and P = 0.021; in MJD DMSO versus MJD OSMI-1, paired t test and P = 0.0023. (D) Western blot for analysis of autophagy markers LC3B-II and p62 in 293T samples obtained after 10 μM OSMI-1 treatment plus 50 nM of the autophagy inhibitor BafA1 4 h before harvesting. Elevated LC3B-II and p62 levels upon OSMI-1 and BafA1 treatment suggest increased autophagic flux. β-actin served as loading control. - BafA1 = without BafA1; and + BafA1 = with BafA1. n = 3 and two-way ANOVA with Sidak’s post hoc test; in 10 μM OSMI-1 BafA1 versus DMSO BafA1, P = 0.0001 for p62 and P = 0.001 for LC3-II. (E) Western blot of iCN from MJD patients showing the reduction of global O-GlcNAc and of soluble ataxin-3 in samples treated with OSMI-1. Treatment of iCN derived from three MJD patients with 10 μM OSMI-1 for 24 h or 72 h, or 30 μM OSMI-1 for 24 h resulted in decreased polyQ-expanded ataxin-3 (Atx3 flexp, red arrowhead) in all three conditions compared to DMSO control (0 μM OSMI-1), whereas a significant reduction of WT Atx3 (Atx3 flwt, blue arrowhead) was only achieved with 30 μM OSMI-1 for 24 h GAPDH served as loading control. n = 3 and one-sample t test; in Atx3 flwt. 0 versus 30 μM OSMI-1, P = 0.0003; in Atx3 flexp 0 versus 10 μM OSMI-1 24 h, P = 0.0008; in Atx3 flexp 0 versus 10 μM OSMI-1 72 h, P = 0.016; and in Atx3 flexp 0 versus 30 μM OSMI-1 24 h, P = 0.003. (F) Filter retardation analysis of samples used in E revealing a reduction of ataxin-3 protein aggregates upon OSMI-1 treatment. n = 3 and one-sample t test; in 0 versus 10 μM OSMI-1 24 h, P = 0.043; in 0 versus 10 μM OSMI-1 72 h, P = 0.026; and in 0 versus 30 μM OSMI-1, P = 0.046. Data are represented as means ± SEM *P ≤ 0.05, **P ≤ 0.01, ***P ≤ 0.001, and ns = not significant.