|
FIGURE 5
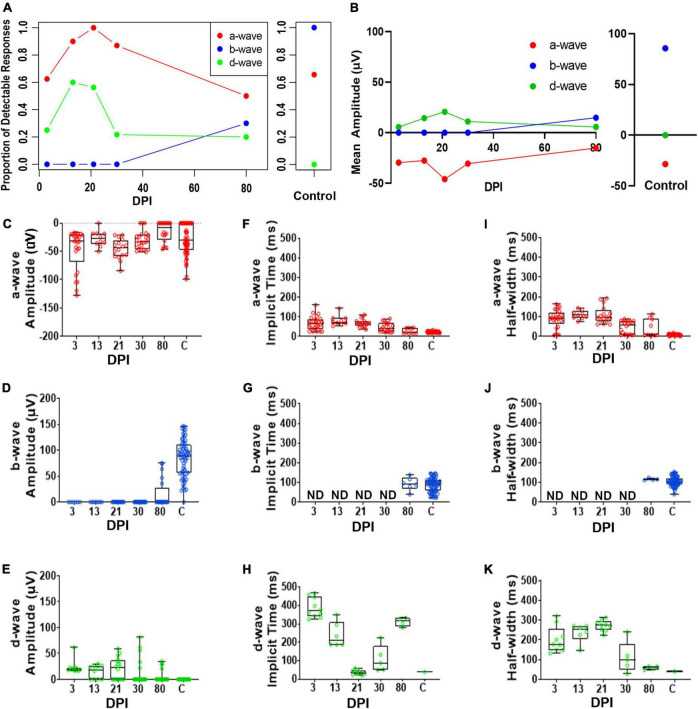
Quantitative analyses of identified a-, b-, and d-waves over a regeneration time-course following a selective lesion.

|
|
FIGURE 5
Quantitative analyses of identified a-, b-, and d-waves over a regeneration time-course following a selective lesion.