
Fig. 2
- ID
- ZDB-IMAGE-221220-47
- Publication
- Pereira Sena et al., 2021 - Pathophysiological interplay between O-GlcNAc transferase and the Machado-Joseph disease protein ataxin-3
- All Figures
- Figures for Pereira Sena et al., 2021
|
Fig. 2
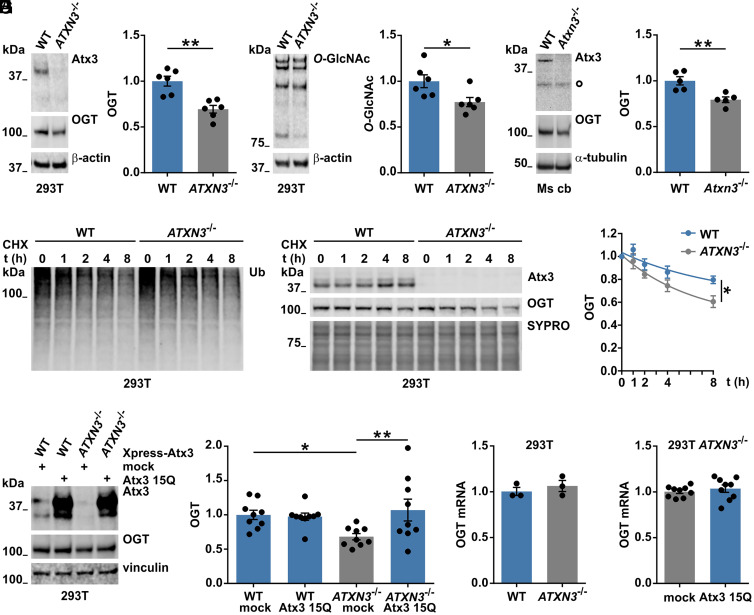
Wild-type ataxin-3 regulates OGT levels. (A and B) Western blot analysis of wild-type (WT) and ataxin-3 knockout (ATXN3−/−) 293T samples for assessing baseline OGT levels. Comparison showed decreased OGT (A) and decreased global O-GlcNAc (B) in 293T ATXN3−/− cells. β-actin served as loading control. (A) n = 6, unpaired t test, and P = 0.001; (B), n = 6, unpaired t test, and P = 0.025. (C) Western blot of cerebellar lysates from 11-mo-old mice showed decreased OGT levels in the cerebellum (Ms cb) of ataxin-3 knockout (Atxn3−/−) mice compared to WT animals. White bullet sign (^) indicates unspecific bands. n = 5, unpaired t test, and P = 0.005. (D) Time-dependent reduction of Ub chains in cells treated with 25 μM of CHX for assessing OGT degradation in presence or absence of ataxin-3. (E) Western blot depicting an increased degradation of OGT in 293T ATXN3−/− compared to WT cells. SYPRO staining served as loading control. n = 3, one phase decay, and P = 0.005 (rejected null hypothesis that one curve fits both datasets). WT versus ATXN3−/− 8 h, unpaired t test, and P = 0.037. (F) Analysis of samples from WT and 293T ATXN3−/− cells transfected with control (mock) or Xpress-tagged wild-type ataxin-3 (Atx3 15Q) vectors revealed a rescue of OGT protein levels in 293T ATXN3−/−cells transfected with ataxin-3 15Q. n = 9, two-way ANOVA with Fisher’s Least Significant Difference (LSD) post hoc analysis, WT mock versus ATXN3−/− mock, P = 0.022; ATXN3−/− mock versus ATXN3−/− 15Q, P = 0.006. (G and H) qRT-PCR for OGT gene expression presented no differences in OGT mRNA levels between the investigated genotypes. G, n = 3, and 293T WT versus ATXN3−/−; H, n = 9, and 293T ATXN3−/− mock versus ATXN3−/− 15Q. Data are represented as mean ± SEM, *P ≤ 0.05 and **P ≤ 0.01.