
Fig. 1
- ID
- ZDB-IMAGE-221220-46
- Publication
- Pereira Sena et al., 2021 - Pathophysiological interplay between O-GlcNAc transferase and the Machado-Joseph disease protein ataxin-3
- All Figures
- Figures for Pereira Sena et al., 2021
|
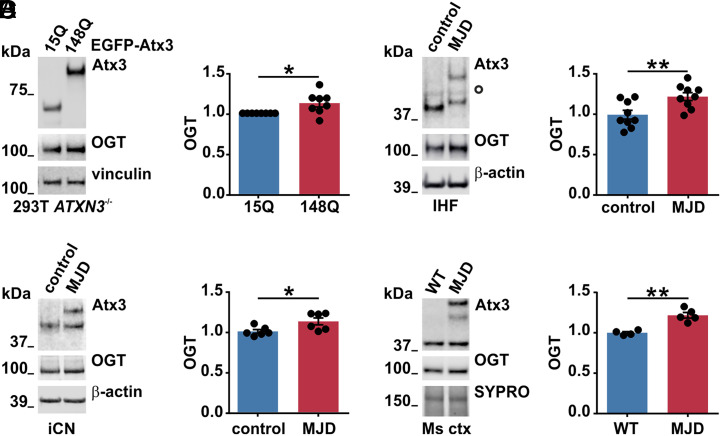
Fig. 1
Increased OGT levels in various models of MJD. (A) Western blot analysis of samples from ataxin-3 knockout HEK 293T cells (293T ATXN3−/−) expressing EGFP-tagged wild-type (15Q) or polyQ-expanded (148Q) ataxin-3 revealed increased OGT levels in cells expressing ataxin-3 148Q. Vinculin served as loading control. n = 8, one-sample t test, and P = 0.032. (B) Western blot analysis of different batches of IHF of an MJD patient and a matched control demonstrated increased OGT in MJD samples. White bullet sign (^) indicates unspecific bands, and β-actin served as loading control. n = 9, unpaired t test, and P = 0.007. (C) Western blot analysis of two independent batches of iCN from three MJD patients versus three controls revealed increased levels of OGT in patient-derived iCN. β-actin served as loading control. n = 6, unpaired t test, and P = 0.029. (D) Western blot analysis of mouse cortical samples (Ms ctx) from 5-mo-old wild-type (WT) and CamKII/MJD77 transgenic mice (MJD) demonstrated increased OGT levels in MJD mice. SYPRO Ruby staining served as loading control. n = 4 to 5, unpaired t test, and P = 0.001. Data are represented as means ± SEM, *P ≤ 0.05 and **P ≤ 0.01.