
Fig. 1
- ID
- ZDB-IMAGE-221220-25
- Genes
- Publication
- Wang et al., 2022 - Wolfram syndrome 1b mutation suppresses Mauthner-cell axon regeneration via ER stress signal pathway
- All Figures
- Figures for Wang et al., 2022
|
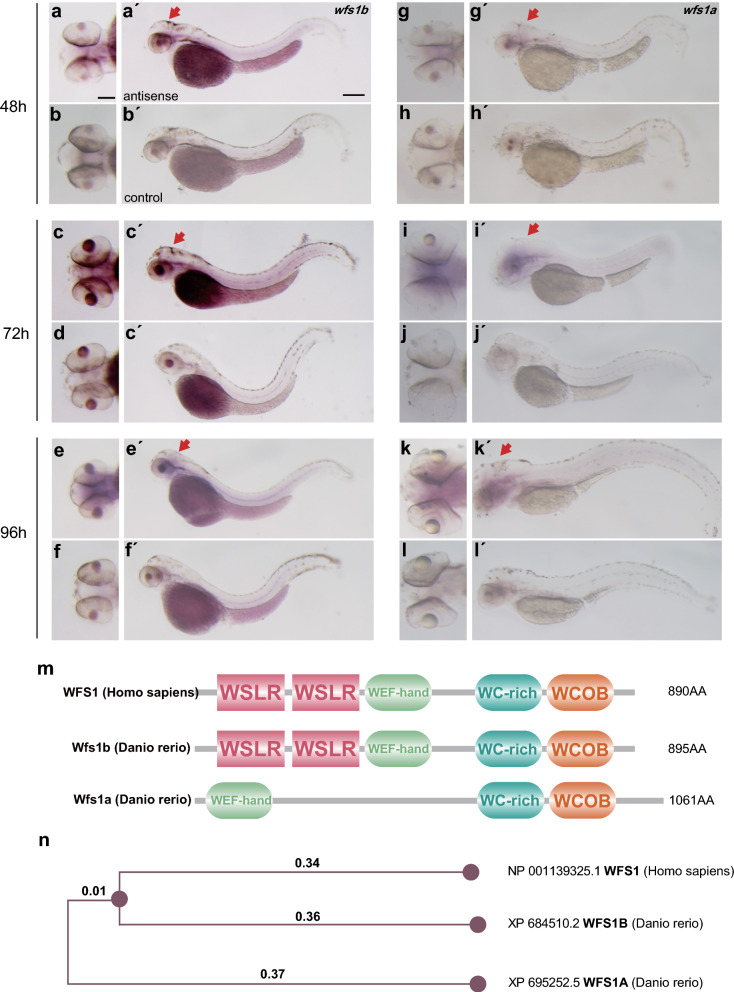
Fig. 1 wfs1a and wfs1b genes in zebrafish larvae. a–f Expression pattern of wfs1b as shown by whole-mount in situ hybridization. a′–f′ were the images of wfs1b expression in the brain of zebrafish larvae. g–l Expression pattern of wfs1a as shown by whole-mount in situ hybridization. g′–l′ were the images of wfs1a expression in the brain of zebrafish larvae. The dorsal view (scale bar, 5 μm) and lateral view (scale bar, 10 μm) of the zebrafish larvae at different stages showed that wfs1b is expressed in the CNS (red arrows) as well as wfs1a. m The predicted protein structure of WFS1 between human and zebrafish. n The phylogenetic tree with the maximum-likelihood algorithm. The numbers represent the length of the evolutionary branch and it determines the degree of homology, Wfs1b has a shorter distance compared to Wfs1a, which means Wfs1b has higher evolutional conservation