
|
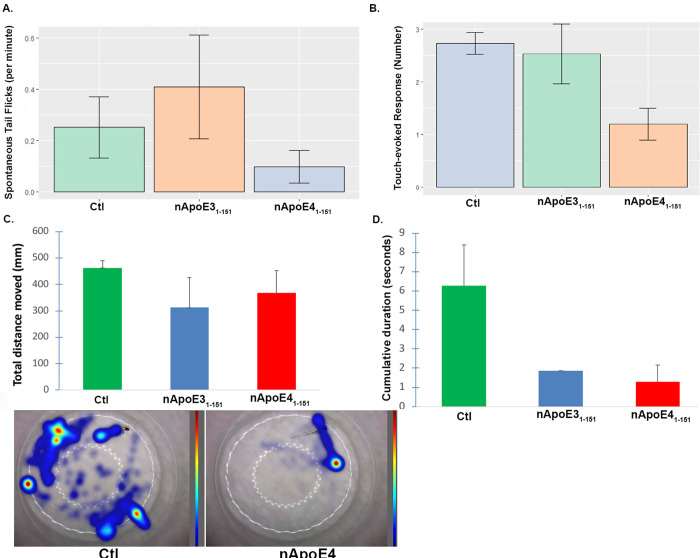
Fig 6 Negative trends in motor behavior in zebrafish following treatment with nApoE41-151.
A. Groups for non-treated controls (green bar), nApoE31-151 25 μg/ml (orange bar), and ApoE41-151 25 μg/ml (blue bar)) were assessed via video monitoring to determine number of spontaneous tail flicks per minute that were then averaged per group for each trial. Data are representative of N = 5 trials, for a total of 25 embryos per group, ±SEM. Data depicted show limited spontaneous tail flick activation from every group with no difference detectable between groups (F(2,27) = 1.24, p = 0.305). B. Results from the touch-evoked response motor behavior experiment. Non-treated controls had a 90% response rate to the evoked, tactile stimulus, whereas for nApoE41-151-treated groups responded to fewer than 50% of stimuli. No significant difference was observed (F(12) = 1.482, p = 0.266). C and D. Results from TEMR analyses similar to Panels A and B with the exception that in this case, total distance traveled (C) or the total time swimming (D) were recorded via video monitoring and using Noldus tracking software. For Panel C, representative heat maps of individual larvae representing either wild-type controls (left Panel), or a low-performing nApoE41-151-treated zebrafish (right Panel). Each bar represents the average total distance traveled or averaged cumulative duration during 5 independent trials, for a total of 15 embryos per group, (±SEM). No significant differences were observed, with for example the Ctl group vs. nApoE41-151 having a p value = 0.08 in Panel C. P-values for Panel D were Ctl vs. E3 fragment = 0.86 and Ctl vs. E4 fragment = 0.06.