IMAGE

Figure 4

ID
ZDB-IMAGE-221218-17
Source
Figures for Martin et al., 2022
Image
Figure Caption

Figure 4

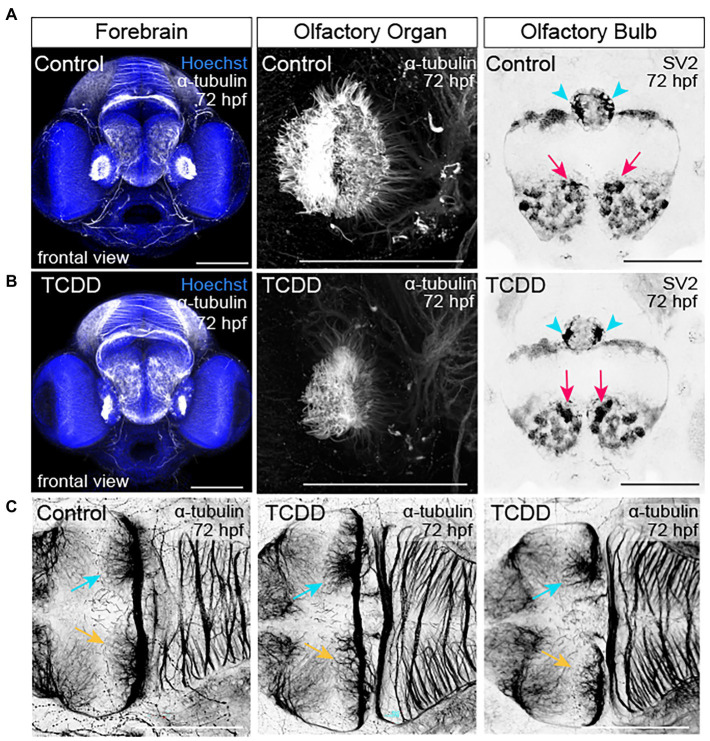
TCDD exposure disrupts development of the olfactory organs, olfactory bulbs, and habenular nuclei. (A,B) Frontal views of the embryonic forebrain at 72 hpf in control (A) and TCDD-exposed (B) larval zebrafish. Embryos were immunolabeled with an anti-acetylated α-tubulin antibody to visualize developing axon tracks (white and inverted to black) and stained with Hoechst (DNA, blue) to mark the parenchyma. Glomeruli in the olfactory bulb were visualized using anti-synaptic vesicles 2. TCDD exposure disrupted development of both the olfactory organs and the glomeruli in the olfactory bulbs. Pink arrows indicate the medial glomerular clusters in the olfactory organs. Mitral cells in medial glomerular clusters make asymmetric, direct projections to the right habenular nuclei (aqua arrows, yellow arrows indicate the left nuclei). (C) Development of the habenular nuclei was impaired at 48 hpf (see Supplementary Figure 4) and abnormal in all larvae scored at 72 hpf. Two examples of the habenular phenotypes are shown in C. Olfactory organ: n = 10 fish/group across 3 replicates. Olfactory bulb: n = 7–10 fish/group across 2 replicates. Habenula: n = 7–10 fish/group across 2 replicates. The dorsal surface of the brain is at the top and the ventral surface is at the bottom in (A,B). Anterior is at the top in (C). Scale bar = 100 μm.

Acknowledgments
This image is the copyrighted work of the attributed author or publisher, and ZFIN has permission only to display this image to its users. Additional permissions should be obtained from the applicable author or publisher of the image. Full text @ Front. Mol. Neurosci.