
Fig. 4
- ID
- ZDB-IMAGE-221215-7
- Publication
- Yin et al., 2021 - CRISPR/Cas9 in zebrafish: An attractive model for FBN1 genetic defects in humans
- All Figures
- Figures for Yin et al., 2021
|
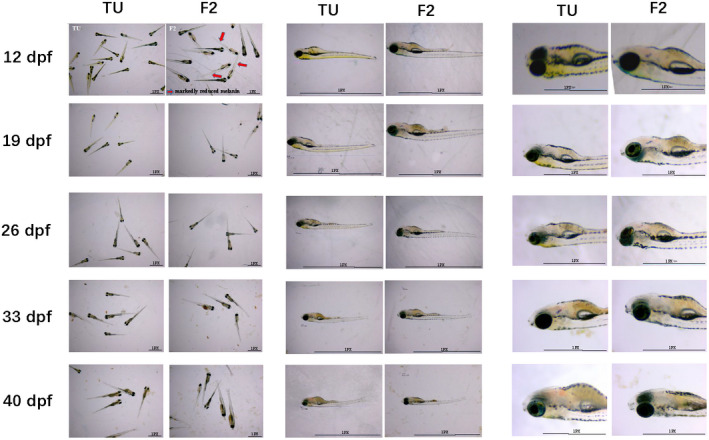
Fig. 4
Comparison of the morphology, head, and heart between F2 fbn1 +/− and TU wild‐type zebrafish larvae. Representative images of the morphology of F1 and F2 fbn1 +/− zebrafish at 12, 19, 26, 33, and 40 days post‐fertilization are shown. F2 fbn1 +/−zebrafish exhibited more noticeably decreased melanin, the red arrow in the figure refers to the typical representatives of F2 embryos showing the characteristics of markedly reduced melanin at the 12 days post‐fertilization. Scale bars have been marked in Figure Figure4.4. Magnification eyepiece ×0.6 (left), ×1.0–2.0 (middle), and ×3.5 (right). dpf: days post‐fertilization