
Fig. 3
- ID
- ZDB-IMAGE-221215-6
- Publication
- Yin et al., 2021 - CRISPR/Cas9 in zebrafish: An attractive model for FBN1 genetic defects in humans
- All Figures
- Figures for Yin et al., 2021
|
Fig. 3
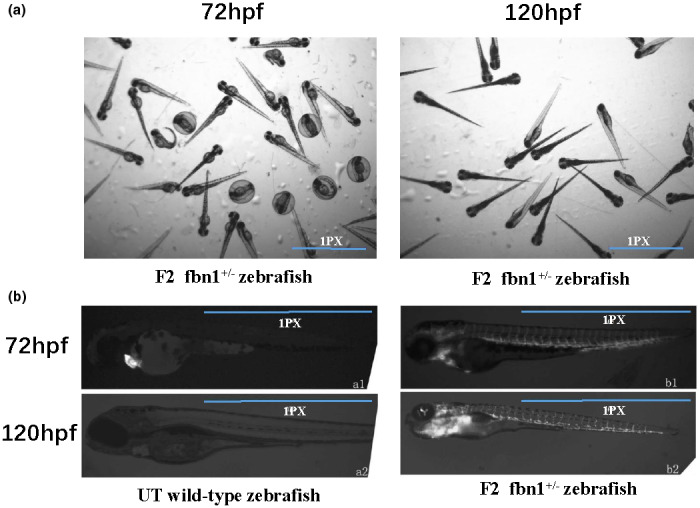
(a) Represents the “family portrait” of the F2 fbn1 +/− zebrafish (experimental group) generated by the hybridization of F1 fbn1 +/− heterozygous mutants and Tg(cmlc2:eGFP) transgenic fluorescent zebrafish. The picture on the left is the morphology of F2 fbn1 +/− zebrafish at 72 hr post‐fertilization, and the picture on the right is a 120‐hr “family portrait” of F2 fbn1 +/− zebrafish. In (b) group a is the fluorescence micrograph of TU wild‐type embryos, and group b is the fluorescence micrograph of F2 embryos (experimental group), where a1 and b1 are 72 hr fluorescence images, a2 and b2 are 120 hr fluorescence images. The results showed that no significant difference was found in the early developmental observation between the TU wild‐type and F2 generation experimental groups. The legend has been marked with the meaning of "a1, a2, b1, b2." Scale bars have been marked in Figure Figure3.3. Magnification eyepiece ×0.6 (A) and eyepiece ×2.0 (B). hpf: hours post‐fertilization