
Fig. 3
- ID
- ZDB-IMAGE-221212-33
- Publication
- Bernardello et al., 2021 - Analysis of intracellular protein dynamics in living zebrafish embryos using light-sheet fluorescence single-molecule microscopy
- All Figures
- Figures for Bernardello et al., 2021
|
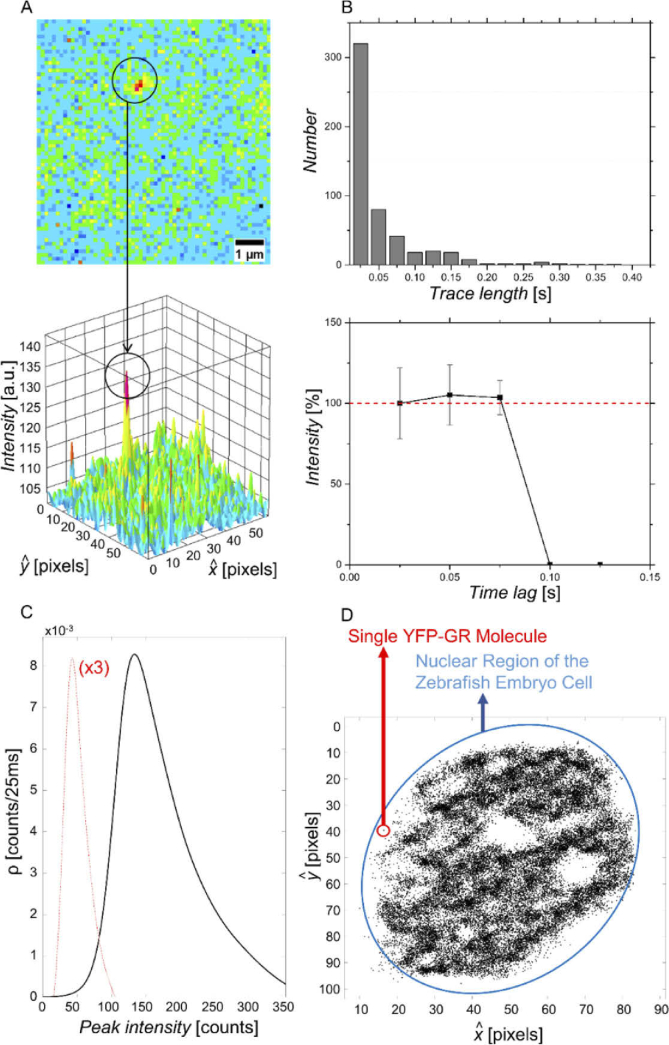
Fig. 3
Characterization of detected fluorescence signals from individual YFP-GR molecules in fixed HEK293 cells. (A) Localization of a single fluorescent molecule. The circle indicates a fluorescence intensity spot that was attributed to an individual YFP molecule based on single-step photobleaching. (B) Top: Bar graph depicting the trace length of 1241 single molecules (521 traces) identified in images of fixed HEK293 cells. The average trace lengths equaled 2.3 frames, and approximately 85% of all traces consisted of 1-3 frames. Bottom: Time trace of the relative single-molecule fluorescence signals determined for all YFP-GR molecules showing a trace length of 1-3 frames. All traces show single-step photobleaching indicating that the signals can indeed be attributed to single YFP-GR molecules. (C) Density (ρ) plot representing the distribution of the peak intensity of 1241 fluorescence signals. The curve is nearly Gaussian-shaped with a maximum of 139.8 counts per 25 ms, corresponding to 22.3 photons. The signal intensity of the background is shown for comparison (dashed red line, density values are multiplied by 3 for better visualization) (D) Localization of single YFP-GR molecules in the nucleus of a nucleus in a living zebrafish embryo. The image depicts a representative localization of YFP-GR molecules, with an average of 19.6 ± 8.7 peaks per frame, accumulated from 3000 consecutive frames. Nucleoli are visible (white circular regions inside of the nucleus), in which YFP-GR molecules are not found.