
Fig. 8
- ID
- ZDB-IMAGE-221211-79
- Publication
- Ablain et al., 2022 - Loss of NECTIN1 triggers melanoma dissemination upon local IGF1 depletion
- All Figures
- Figures for Ablain et al., 2022
|
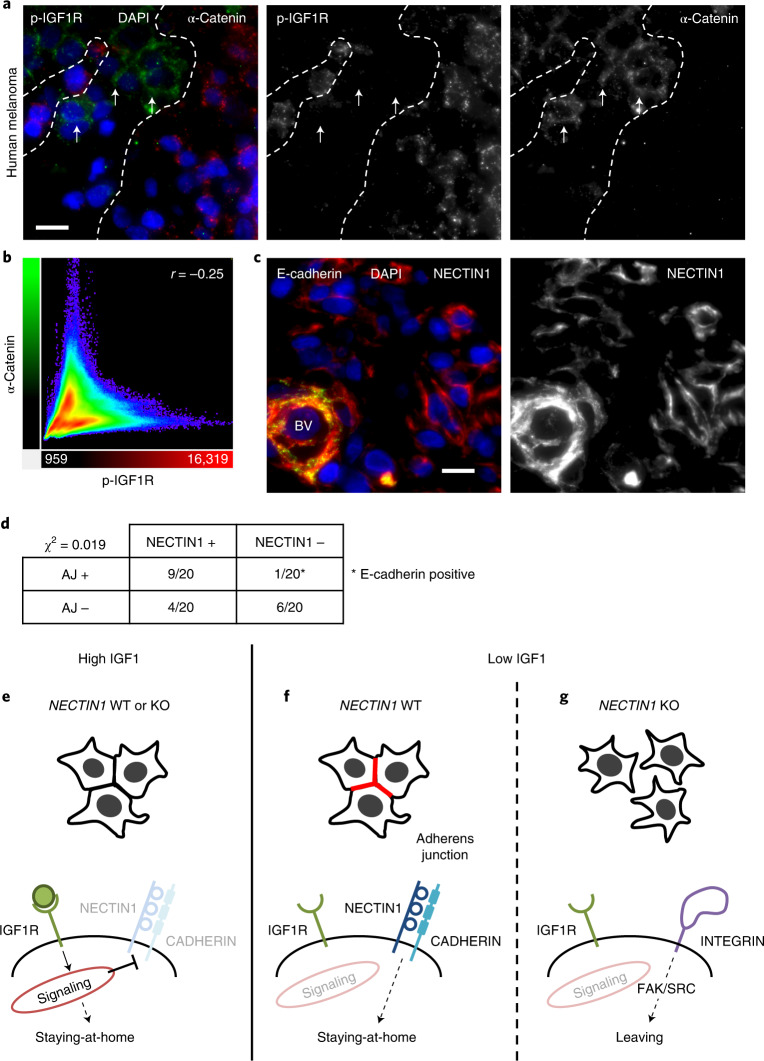
Fig. 8 a, Immunofluorescence analysis of α-catenin (green) and phospho-IGF1R (red) on a tissue section of human melanoma (blue, DAPI). Scale bar, 10 μm. Dotted line demarcates areas of high and low IGF1 signaling. Arrows point to adherens junctions. A representative example of nine independent tumors is shown. b, Diagram representing signal intensities of α-catenin (green) and phospho-IGF1R (red) in the section shown in panel a (Pearson’s correlation). c, Immunofluorescence analysis of E-cadherin (green) and NECTIN1 (red) (blue, DAPI) on a tissue section of the same tumor as in panel a. Scale bar, 10 μm. BV, blood vessel. d, Table showing the distribution of 20 tissue sections of human melanoma depending on the presence or absence of adherens junctions (as assessed by α-catenin staining) and NECTIN1 by immunofluorescence. Correlation was measured by chi-squared test. Note that the only NECTIN1-negative tumor exhibiting adherens junctions was positive for E-cadherin. e–g, Model for the role of NECTIN1 in melanoma. e, In the presence of IGF1, melanoma cells actively repress the formation of adherens junctions and proliferate, independent of NECTIN1 status. f, In the absence of IGF1, NECTIN1-wild-type melanoma cells form robust adherens junctions (red) and rely on cell–cell adhesion to stay in the niche. g, In the absence of IGF1, NECTIN1-deficient melanoma cells (that are unable to establish adherens junctions) switch to cell–matrix adhesion and activate an integrin/FAK/SRC axis, leading to their migration and dissemination.