
Fig. 4
- ID
- ZDB-IMAGE-221211-73
- Publication
- Ablain et al., 2022 - Loss of NECTIN1 triggers melanoma dissemination upon local IGF1 depletion
- All Figures
- Figures for Ablain et al., 2022
|
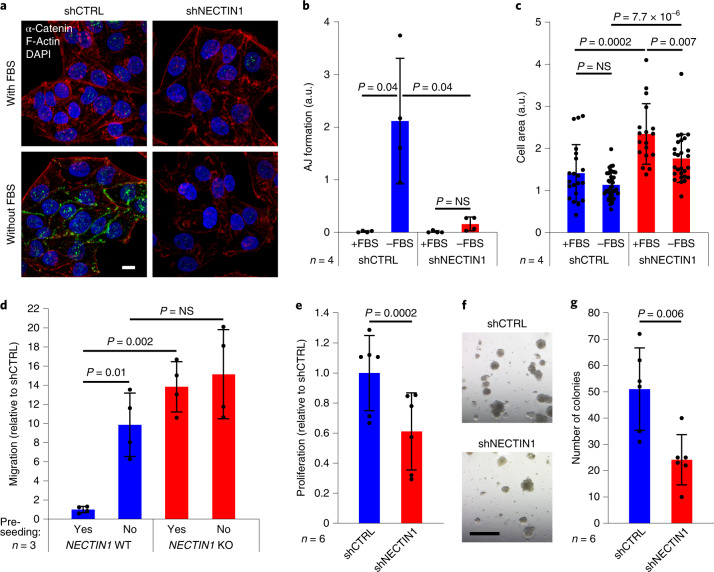
Fig. 4 a, Immunofluorescence analysis of α-catenin (green) and F-actin (red) in A375 human melanoma cells stably expressing a control shRNA (shCTRL) or an shRNA directed against NECTIN1 (shNECTIN1) cultured in the presence or absence of serum (FBS) for 12 h. Scale bar, 10 μm. Representative images of five independent experiments are shown. DAPI, 4,6-diamidino-2-phenylindole (blue), b, Quantification of adherens junction (AJ) formation as measured by α-catenin signal intensity on immunofluorescence images as shown in panel a. Data represent mean ± s.d. (n = 4 fields per condition; paired two-tailed t-test). c, Quantification of cell surface area based on immunofluorescence images as shown in panel a. Data represent mean ± s.d. (n = 21, 38, 18, 27 cells for shCTRL+FBS, shCTRL-FBS, shNECTIN1+FBS, and shNECTIN1-FBS, respectively; paired two-tailed t-test). d, Migration of three NECTIN1-knockout (KO) A375 human melanoma cell lines relative to three NECTIN1-wild-type (WT) A375 human melanoma cell lines in a transwell assay after 12 h of serum starvation. Cells were either allowed to settle for 12 h (pre-seeding) or not before being put in the presence of the chemotactic gradient. Cells were allowed to migrate for 6 h. Data represent mean ± s.d. of three independent experiments (paired two-tailed t-test). e, Proliferation of the cells described in panel a. Data represent mean ± s.d. of six independent experiments (paired two-tailed t-test). f, Representative images of colonies formed in Matrigel by the cells described in panel a after 14 days in culture. Scale bar, 1 mm. g, Number of colonies quantified from the experiments described in panel f. Data represent mean ± s.d. of six independent experiments (paired two-tailed t-test).