
Image
|
Figure Caption
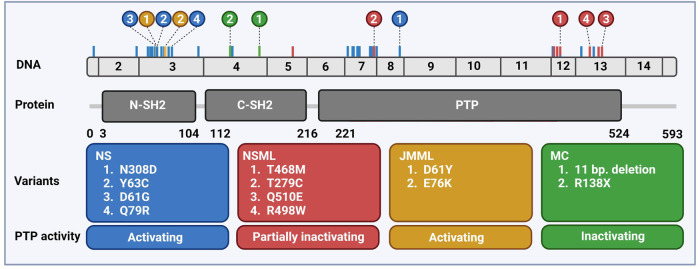
FIGURE 1 Distribution of PTPN11 genetic variants associated with rare diseases. Schematic overview of the exonic structure of PTPN11, consisting of 15 exons (above) and the encoded protein SHP2 (below) with two SH2 domains and the catalytic PTP domain. Frequently occurring mutations are indicated color-coded corresponding to the boxes with the 2–4 most frequently occurring mutations highlighted. Created using BioRender (BioRender.com).
Acknowledgments
This image is the copyrighted work of the attributed author or publisher, and
ZFIN has permission only to display this image to its users.
Additional permissions should be obtained from the applicable author or publisher of the image.
Full text @ Front Cell Dev Biol