
Image
|
Figure Caption
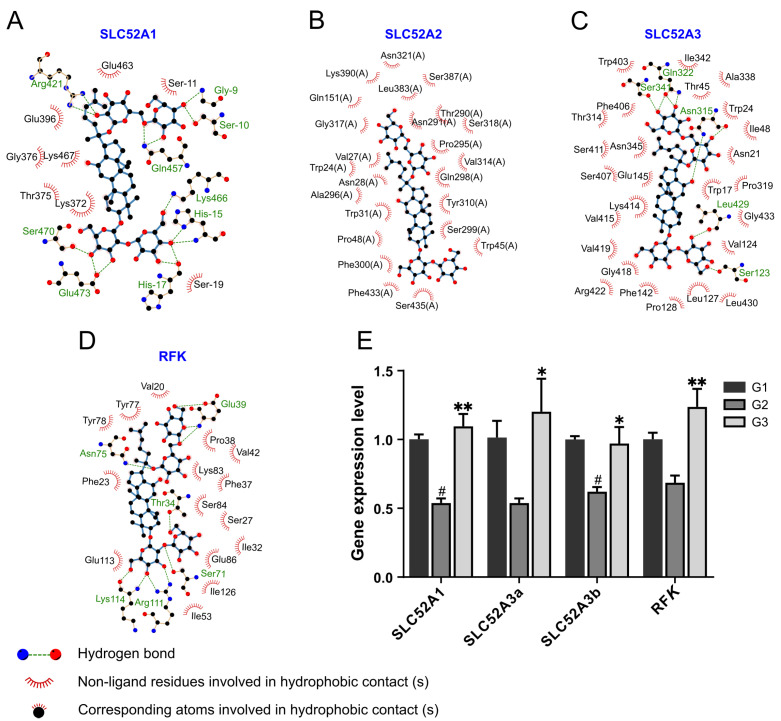
Figure 5 Verification of the role of GRb1 in riboflavin metabolic pathway. (A–D) Ligplot + results for schematic ligand interactions of 4 proteins related to riboflavin metabolic pathway with GRb1 showing hydrogen bonding and hydrophobic interactions. (E) Expression of the mRNA of the proteins related to riboflavin metabolic pathway in larvae after GRb1 treatment. Results are expressed as mean ± SEM, n = 3 per group. # p < 0.05 vs. G1. ** p < 0.01, * p < 0.05 vs. G2. G1, larvae exposed in E3 water; G2, larvae treated with 4% glucose; G3, larvae treated with 4% glucose + 100 μg/mL GRb1.