
Image
|
Figure Caption
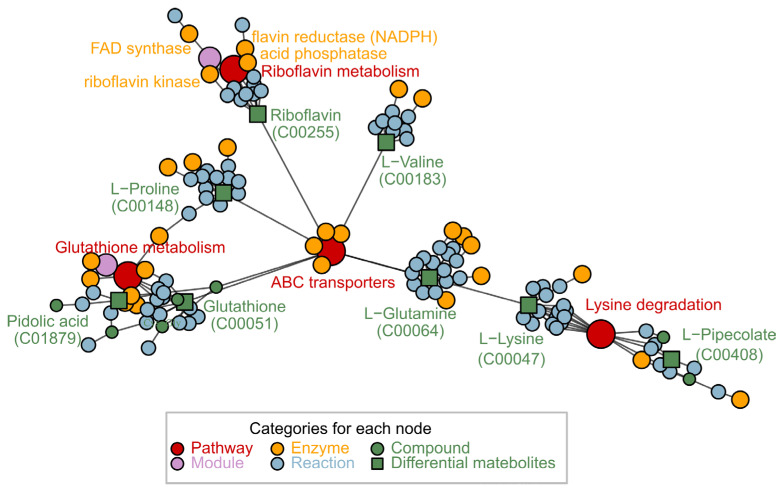
Figure 4 Network diagram related to differentially expressed metabolic pathways after GRb1 treatment by FELLA.
Acknowledgments
This image is the copyrighted work of the attributed author or publisher, and
ZFIN has permission only to display this image to its users.
Additional permissions should be obtained from the applicable author or publisher of the image.
Full text @ Metabolites