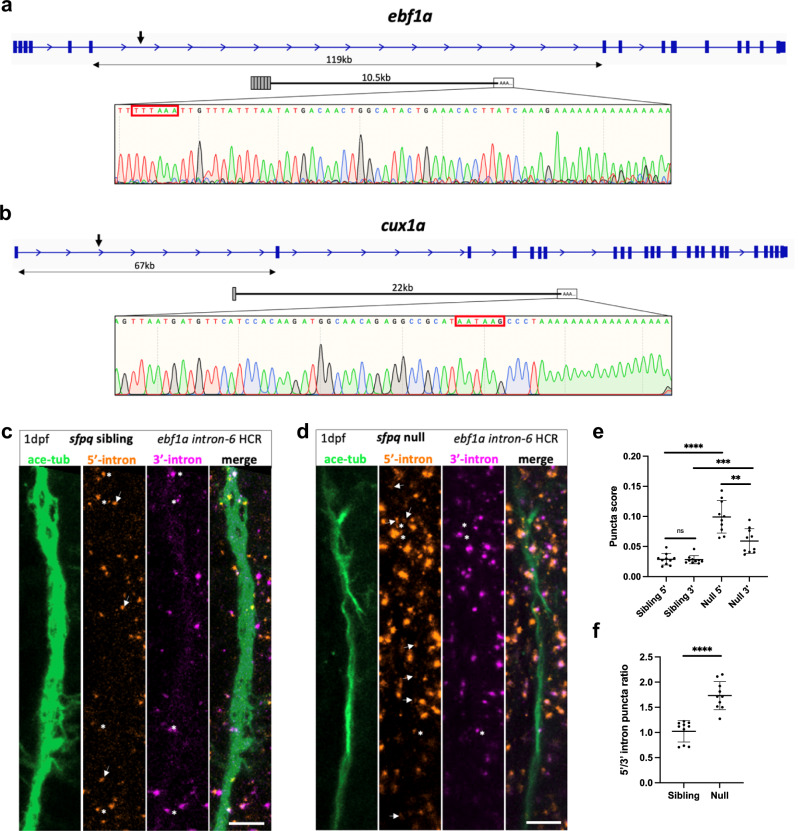
Fig. 6
a, b Sequencing traces from 3’RACE products of PreT-IR transcripts for ebf1a (a) and cux1a (b), zebrafish homologues of ALS-affected EBF1 and CUX1, show terminal intronic sequences with polyadenylation signals (red boxes) and start of the polyA tail. a ebf1a PreT-IR transcript comprises exons 1–6 + 10.5 kb intron-6 and polyA tail. b cux1a PreT-IR transcript comprises exon 1 + 22 kb intron-1 and polyA tail. c, d Confocal z-projections (10 μm) of 1dpf/24hpf sfpq sibling (c) & null (d) embryo axons, immunolabelled by targeting acetylated-tubulin, and ebf1a intron-6 IR and PreT-IR transcripts labelled by HCR with probe sets targeting the 5’-most 10 kb of intron-6 (red) and the 3’-most 10 kb of intron-6 (magenta). Axons running longitudinally, situated just anterior to the otic vesicle, were imaged in each embryo. Asterisks show axon localised RNAs labelled by both 5’ and 3’ intron-6 probe sets. Arrows show axon localised RNAs labelled by 5’ intron-6 probe sets only. Note that HCR RNA puncta are also present in neuronal cell bodies surrounding shown axons. Scale bars 10 μm. e, f Quantification of 5’ and 3’ intron-6 puncta in sibling (c) versus null (d) axons. Each datapoint represents a different embryo. N = 10 sibling and 10 null embryos. Two-tailed unpaired t tests with Welch’s correction, **p:0.0016, ***p:0.0008 ****p < 0.0001. Means plotted with SD. Source data are provided as a Source Data file.

