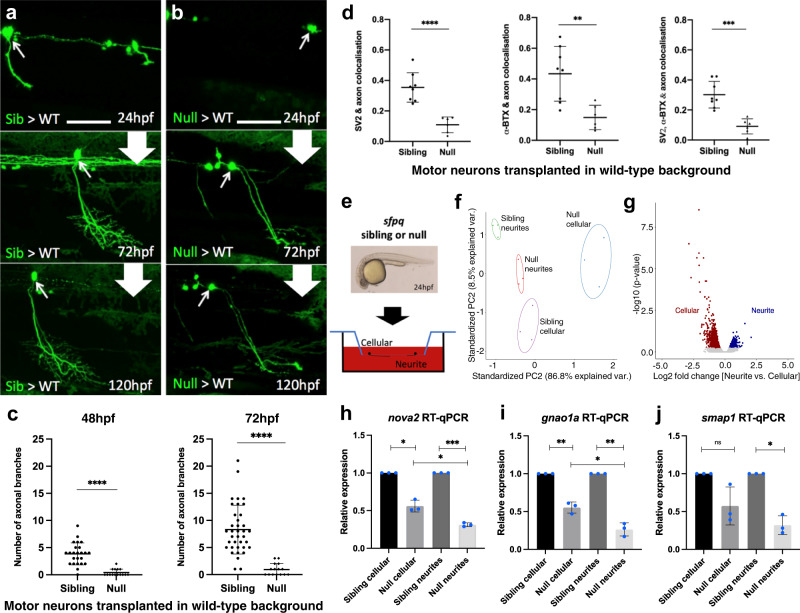
Fig. 1
a, b Confocal z-projections (150 μm), lateral view, anterior to the left, of transplanted sfpq; tg(mnx1:GFP) sibling (a) & null (b) motor neurons in wild-type hosts. Scale bar 25 μm. c Quantification of all branches on transplanted sibling and null GFP + motor neurons at 48 hpf (Left) and 72 hpf (Right). Each datapoint represents an individual neuron. Two-tailed, unpaired t tests with Welch’s correction. Means plotted with SD. (48 hpf) Sibling: 24 neurons, 9 hosts (6 donors), Null: 15 neurons, 4 hosts (4 donors), ****p < 0.0001. (72 hpf) Sibling: 37 neurons, 14 hosts (11 donors), Null: 15 neurons, 4 hosts (4 donors), ****p < 0.0001. d Quantification of axon colocalisation with synaptic markers. The portion of axon overlapping with each marker was calculated. Each point represents an axon of a different neuron. Sibling, n: 8 neurons from 3 hosts (2 donors); null n: 6 neurons from 2 hosts (2 donors). Two-tailed Unpaired ttests performed with Welch’s correction. Mean plotted with SD. (Left) ****p < 0.0001, (Middle) **p:0.0024, (Right) ***p:0.0001. e Sibling versus null cells from dissociated sfpq, tg(mnx1:GFP) embryos were plated onto the upper membrane surface transwell inserts. Neurites can extend through 1 μm pores and adhere to the lower surface. f Principal component analysis plot of the 12 cellular and neurite RNA samples using 1359 highly variant genes. g Plot showing clusters for transcripts enriched in sibling cellular and neurite compartments. Cellular: FC > 1.5, p < 0.05; 1030 genes. Neurite: FC > 1.25, p < 0.05; 329 genes (p-values calculated using two-sided Wald tests). h–j RT-qPCR validation of neurite-specific gene downregulation in null (n = 3 biological replicates, blue dots). Expression normalised to relevant compartment actl6a expression. Sibling expressions were set to 1. Two-tailed unpaired ttests with Welch’s correction. Means plotted with SD. h nova2, cellular, *p:0.0103; neurite, ***p:0.0004; cellular vs neurite, *p: 0.0232. i gnao1a, cellular, **p:0.009; neurite, **p:0.0045; cellular vs neurite, *p:0.0121. j smap1, cellular, p = 0.0989; neurite, *p:0.0111. Source data are provided as a Source Data file.

