
|
Fig. 4
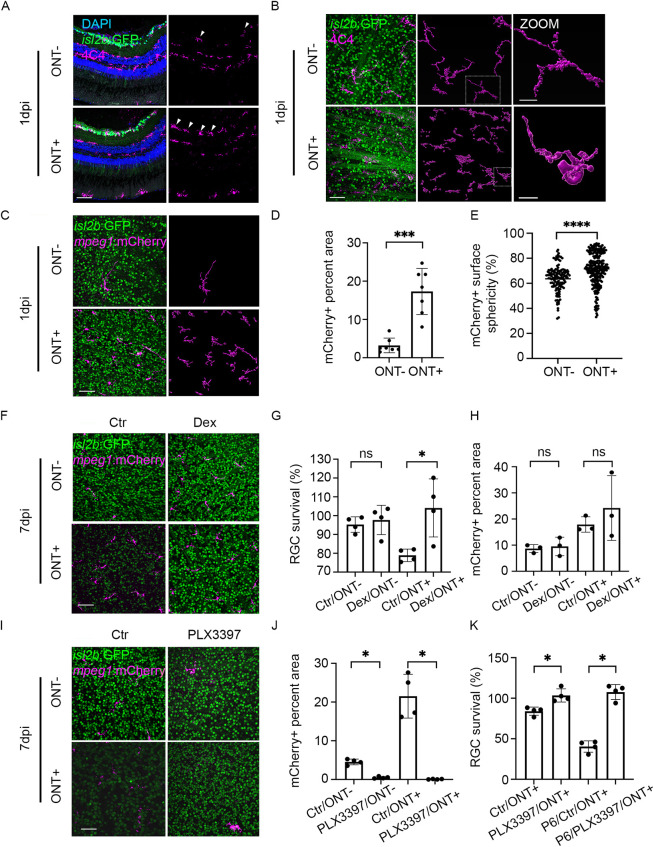
Macrophages/microglia are recruited to the GCL after ONT and mediate RGC death. (A,B) Immunostaining of 4C4 (magenta) on isl2b:GFP retinal cryosections (A) and retinal flat mounts at 1 dpi with surface renderings of 4C4+ macrophages/microglia generated in Imaris (B). (C) Images of retinal flat-mounts from isl2b:GFP;mpeg1:mCherry animals at 1 dpi. mCherry+ macrophages/microglia (magenta) surfaces were rendered in Imaris. (D) Quantification of the surface area within the GCL occupied by mCherry+ macrophages/microglia at 1 dpi (n=7/condition). Shown are mean±s.d.; ***P<0.001; Mann–Whitney test. Data derived from one experiment. (E) Violin plot showing a significant increase in sphericity of mCherry+ macrophages/microglia in ONT+ retinae compared with ONT− controls (n=140 in ONT− and n=272 in ONT+). ****P<0.0001; unpaired t-test with Welch's correction. (F) Flat-mount images of isl2b:GFP;mpeg1:mCherry retinae after IV injection of dexamethasone (Dex) or DMSO (Ctr) at 7 dpi. (G) RGC survival in dexamethasone-treated retinae increased significantly at 7 dpi compared with control (n=4/condition). Shown are mean±s.d.; *P<0.05; Kruskal–Wallis ANOVA test with Dunn's multiple comparisons. Data derived from three experiments. (H) Quantification of mCherry+ macrophage/microglia coverage of the GCL after ONT and dexamethasone or DMSO injection (n=3/condition). Shown are mean±s.d.; Kruskal–Wallis ANOVA test with Dunn's multiple comparisons. No significant differences were detected. Data derived from three experiments. (I) Flat-mount images of isl2b:GFP;mpeg1:mCherry retinae after PLX3397 treatment or housed in system water (Ctr) at 7 dpi. (J) Quantification of mCherry+ macrophage/microglia coverage of the GCL after ONT and PLX3397 treatment (n=4/condition). Shown are mean±s.d.; *P<0.05; Kruskal–Wallis ANOVA test with Dunn's multiple comparisons. Data derived from three experiments. (K) RGC survival in PLX3397-treated retinae increased significantly at 7 dpi compared with control. Similarly, RGC survival in PLX3397-treated retinae increased significantly after P6 addition compared with DMSO controls (n=4/condition). Shown are mean±s.d.; *P<0.05; Mann–Whitney test. Data derived from three experiments. Scale bars: 50 μm. ns, not significant.