
|
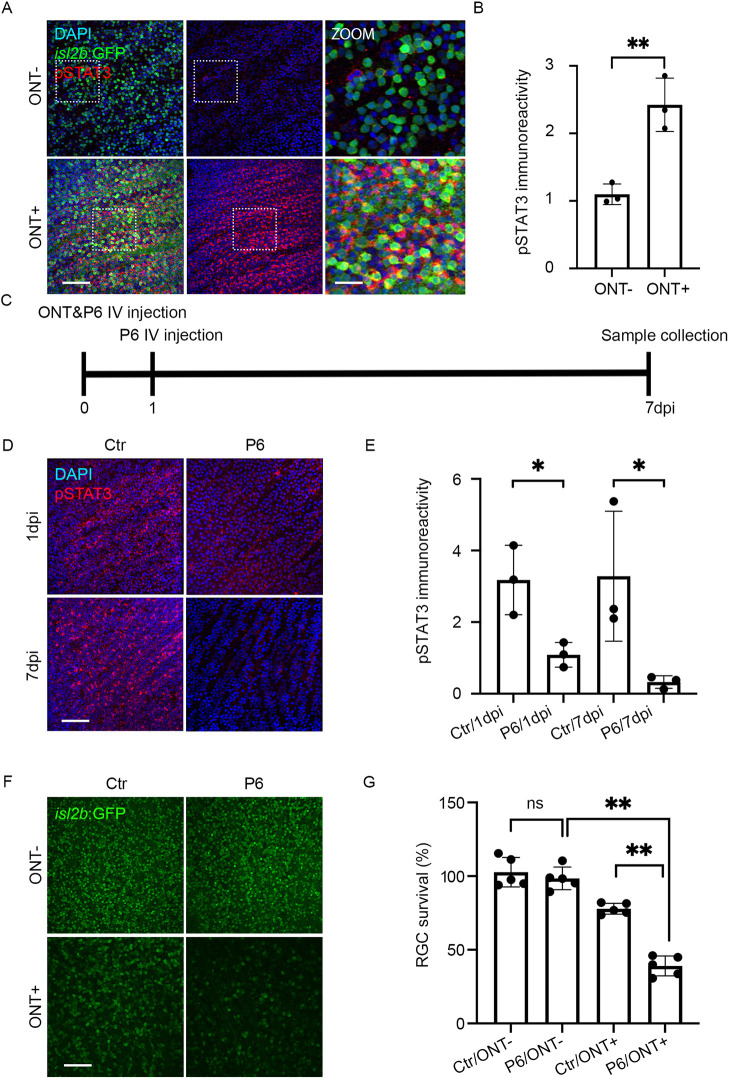
Fig. 3
Jak/Stat pathway activity is required for RGC survival after ONT. (A) pStat3 expression (red) in flat-mount isl2b:GFP ONT− and ONT+ retinae at 1 dpi. Nuclei are stained with DAPI (blue). Right-hand panels show 3× magnifications of the boxed regions in the 40× images. (B) Quantification of pStat3 levels at 1 dpi. pStat3 levels in ONT+ RGCs are shown relative to those in ONT− retinae. Shown are mean±s.d. of n=3 for each group; **P<0.01; Mann–Whitney test. Data derived from three experiments. (C) Experimental protocol to assess Jak requirement for RGC survival after ONT. (D) pStat3 expression in ONT+ isl2b:GFP retinal flat mounts at 1 and 7 dpi with or without IV injection of the Jak inhibitor P6. DMSO was used as control (Ctr). (E) Quantification of pStat3 expression after P6 application at 1 and 7 dpi. n=3/condition. Shown are mean±s.d.; *P<0.05, Mann–Whitney test. Data derived from three experiments. (F) Images of P6- or DMSO-injected flat-mount isl2b:GFP retinae at 7 dpi. (G) Quantification of RGC survival after P6 injection (n=5/condition). Shown are mean±s.d.; **P<0.01; Kruskal–Wallis ANOVA with Dunn's multiple comparisons. Scale bars: 50 μm (A, main panels; D,F); 150 μm (A, zoom). Data derived from four experiments.