
Image
|
Figure Caption
Fig. 10
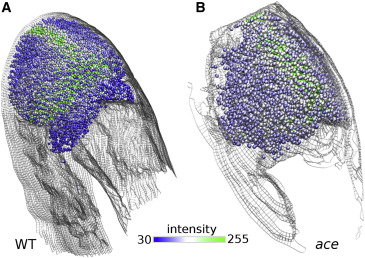
Figure 10. Combining models from two imaging channels. Spatial distribution of wnt1 expression from the GFP channel autofluorescence image over BOC of WT (A) and ace embryos at 27.5 hpf (B). One bead represents a 6 × 6 pixel area. Bead color represents the intensity of the wnt1 reporter fluorescence. Beads are not assigned to areas with pixel intensity below 30.
Acknowledgments
This image is the copyrighted work of the attributed author or publisher, and
ZFIN has permission only to display this image to its users.
Additional permissions should be obtained from the applicable author or publisher of the image.
Full text @ Biophys Rep