
|
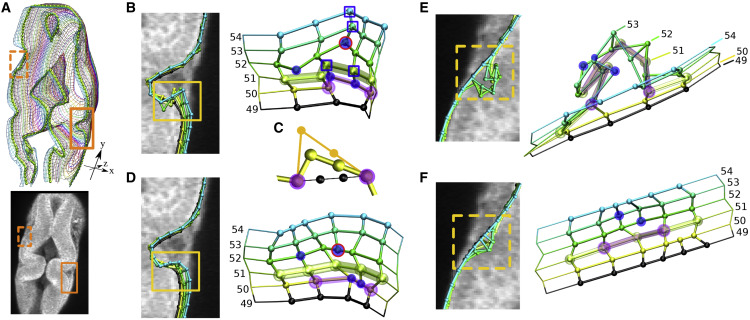
Fig. 6
Figure 6. Depress mesh protrusions. (A) Mesh from Fig. 1 G colored by slice. Autofluorescence image below and in all panels corresponds to slice 51. Before (B and E) and after (D and F) mesh refinement images are shown. Insets are side views for the rectangles. Protruding beads are marked in blue. (B) Intervening beads are marked with blue squares. (C) Depressing the protrusion on slice 50 of (B) (purple highlight) using guiding points (black) on the line between the flanking beads (purple). Chain before smoothing the protrusion is shown in orange. (E) A protruding segment on slice 51 is highlighted in purple. (F) During final refinement, some beads were deleted for the equalize bond length procedure. Also see Fig. S3.