
IMAGE
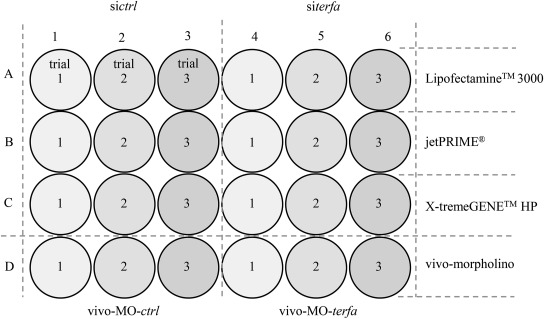
Fig. 1
- ID
- ZDB-IMAGE-221203-1
- Publication
- Hu et al., 2021 - The knockdown efficiency of telomere associated genes with specific methodology in a zebrafish cell line
- All Figures
- Figures for Hu et al., 2021
Image
|
Figure Caption
Fig. 1 Fig. 1. Example for a schematic layout of optimization strategies. 1–2 × 10⁵ ZF4 cells were seeded in 24-well plates. Transfection experiments were proceeded at a final confluence of 50%–70%. Numbers in each well refers to trial-1–3 of each transfection reagent. All transfection methods of an optimization experiment were proceeded at the same time. Optimization was repeated three times for individual experiments.
Acknowledgments
This image is the copyrighted work of the attributed author or publisher, and
ZFIN has permission only to display this image to its users.
Additional permissions should be obtained from the applicable author or publisher of the image.
Full text @ Biochimie