Fig. 7
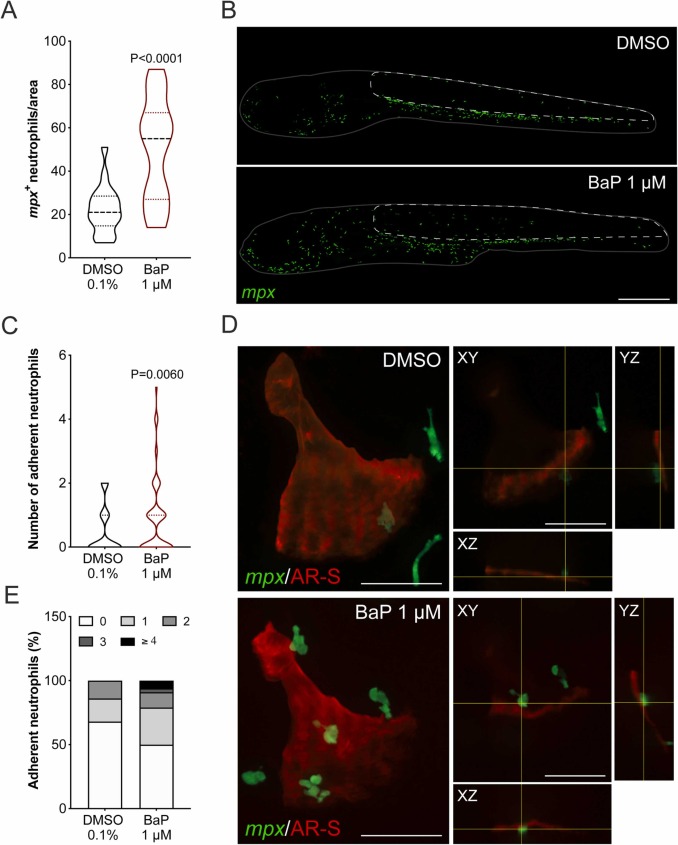
Fig. 7. Number of neutrophils in TgBAC(mpx:EGFP)i114 zebrafish larvae exposed to BaP from 3 to 6 dpf. (A) Number of neutrophils in the region of interest (ROI) expressed in % over control. (B) Representative images of transgenic larvae exposed to 0.1% DMSO or 1 μM BaP, where TgBAC(mpx:EGFP)i114 positive cells are in green. ROI is outlined with a white dashed line, while larvae is outlined with a gray line. Scale bar is 500 µm. P-value calculated using Student's t-test. Values are presented as median and quartiles (n = 18). (C) Number of adherent neutrophils on the opercular bone stained with AR-S. P-value calculated using Mann Whitney test. Values are presented as median and quartiles (n = 109). (D) Representative images of adherent neutrophils on the operculum of larvae exposed to 0.1% DMSO or 1 μM BaP, where TgBAC(mpx:EGFP)i114 positive cells are in green and operculum is in red. On the right side of the representative images, orthogonal projections of the planes (XY, YZ and XZ) marked with the yellow lines. Scale bar is 50 µm. (E) Percentage of adherent neutrophils at 6 dpf per opercular bone. Colors indicate the number of TgBAC(mpx:EGFP)i114 positive cells per operculum. For interpretation of the references to color in this figure legend, the reader is referred to the web version of this article.

