
|
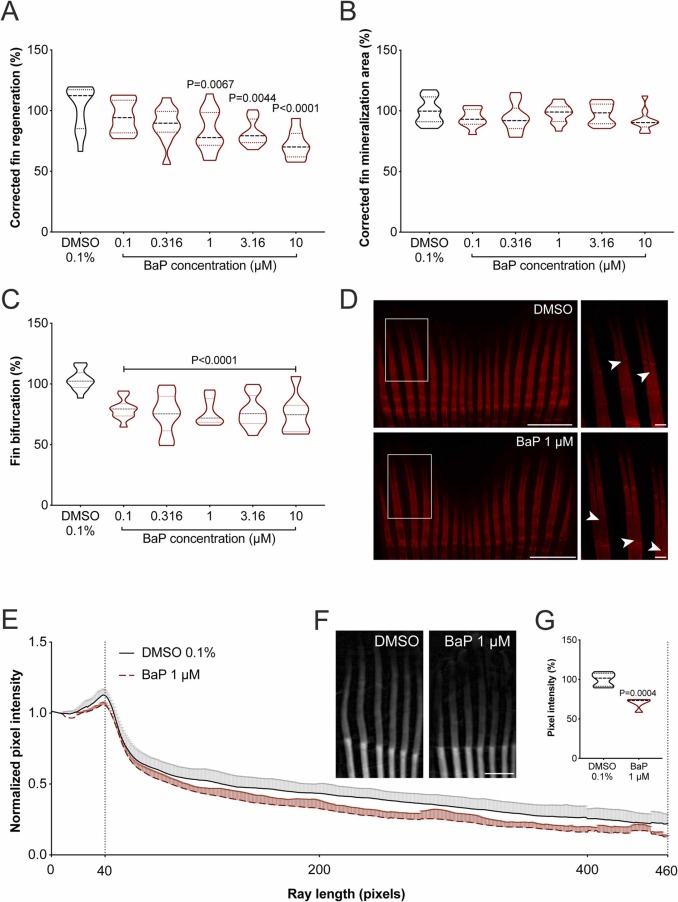
Fig. 4
Fig. 4. Regeneration of the caudal fin in adult zebrafish exposed to increasing concentrations of BaP for 5 days after finectomy. (A) Caudal fin tissue regeneration, (B) de novo bone formation and (C) ray bifurcation was assessed through morphometric analysis of the fin structures in bright-field and fluorescence images. Fin bifurcation corresponds to the ratio between the distance from the stump to the bifurcation point / distance from stump to ray tip (D) Representative images of the regenerating caudal fin rays exposed to 0.1% DMSO or 1 μM BaP. Magnification of the boxed area is presented in the right panel. Arrowheads point to ray bifurcation point. Scale bar is 1 mm in left panels and 0.1 mm in right panels. P-value calculated using one-way ANOVA followed by Dunnett's multiple comparison test. Values are presented as median and quartiles (n ≥ 9). (E-G) Density of regenerating caudal fin rays from adult zebrafish exposed to BaP for 5 days after finectomy assessed through ray pixel intensity micro–computed tomography (µCT) images. (E) Averaged normalized pixel intensity along regenerated rays from 40 (amputation plane) to 460 pixels. (F) Representative µCT images of the regenerating caudal fin rays exposed to 0.1% DMSO or 1 μM BaP. Scale bar is 1 mm. (G) Area under curve (40–460 pixels). P-value calculated using Student's t-test. Values are presented as median and quartiles (n = 5). For interpretation of the references to color in this figure legend, the reader is referred to the web version of this article.