
|
Fig. 3
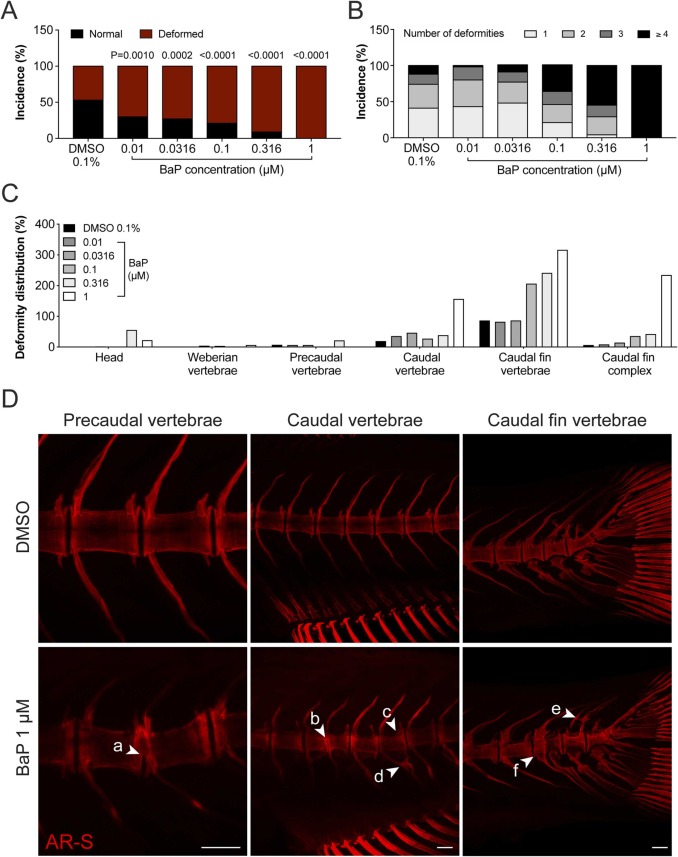
Fig. 3. Deformities in the axial skeleton of 30 dpf juvenile zebrafish exposed to increasing concentration of BaP throughout their development. (A) Percentage of normal and deformed zebrafish. (B) Percentage of deformities per deformed larvae. (C) Distribution of the deformities along the axial skeleton. Deformed structures of each individual were summed and divided by the number of fish. (D) Representative fluorescence images of AR-S stained skeletal structures exposed to 0.1% DMSO or 1 μM BaP. Arrowheads point to: a, partially fused vertebrae; b, fused vertebrae; c, deformed vertebrae; d, fused hemal arches; e, ectopic mineralization; f, platyspondyly. Scale bar is 100 µm. P-value calculated using chi-squared test, 1 degree of freedom. n ≥ 65, except for BaP 1 μM (n = 18). For interpretation of the references to color in this figure legend, the reader is referred to the web version of this article.