Fig. 2
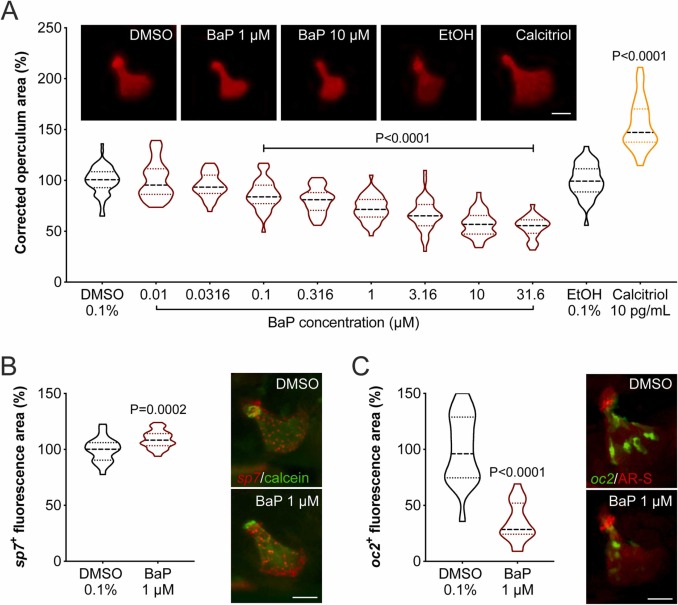
Fig. 2. (A) Operculum growth in zebrafish larvae exposed to increasing concentrations of BaP from 3 to 6 dpf. Regions of interest (operculum and head area) were determined through the morphometric analysis of AR-S stained bone structures imaged by fluorescence microscopy. Representative images of AR-S stained operculum are presented on the top of the graph (background was removed using image processing software to highlight operculum structure). Dimethyl sulfoxide (DMSO) and ethanol (EtOH) were used as vehicle for BaP and calcitriol, respectively. Scale bar is 50 µm. P-value calculated using one-way ANOVA followed by Dunnett's multiple comparison test for BaP/DMSO and Student's t-test for calcitriol/EtOH. Values are presented as median and quartiles (n ≥ 25). (B, C) Expression of osteoblast marker genes in the operculum of zebrafish larvae exposed to 1 μM BaP or 0.1% DMSO from 3 to 6 dpf. (B) osterix (sp7), a marker of immature osteoblasts, appears in red in the Tg(Ola.Sp7:mCherry-Eco.NfsB)pd46 line; operculum is counter-stained with calcein. (C) osteocalcin (oc2), a marker of mature osteoblasts, appears in green in the Tg(Ola.osteocalcin:EGFP)hu4008 line; operculum is counter-stained with AR-S. Representative images of the operculum are presented on the right side of the respective graph. Scale bar is 50 µm. P-value calculated using Student's t-test. Values are presented as median and quartiles (n ≥ 21). For interpretation of the references to color in this figure legend, the reader is referred to the web version of this article.

