
IMAGE
Fig. 6
- ID
- ZDB-IMAGE-221127-6
- Publication
- Webster et al., 2021 - Role of BMP signaling during early development of the annelid Capitella teleta
- All Figures
- Figures for Webster et al., 2021
Image
|
Figure Caption
Fig. 6
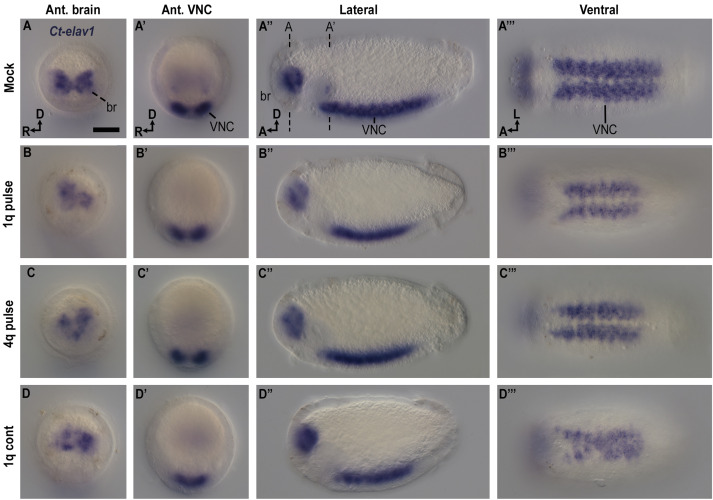
Fig. 6. Ct-elav1 expression in BMP-treated animals. (A–A‴) Mock (n = 37), dashed lines in (A'') represent focal depths of (A) and (A'). (B–B‴) 1q pulse (n = 36). (C–C‴) 4q pulse (n = 36). (D–D‴) 1q cont (n = 45) showing collapse of some hemiganglia expressing Ct-elav1. Scale bar = 50 μm; br: brain, VNC: ventral nerve cord, A, anterior; D, dorsal, L. left.
Acknowledgments
This image is the copyrighted work of the attributed author or publisher, and
ZFIN has permission only to display this image to its users.
Additional permissions should be obtained from the applicable author or publisher of the image.
Reprinted from Developmental Biology, 478, Webster, N.B., Corbet, M., Sur, A., Meyer, N.P., Role of BMP signaling during early development of the annelid Capitella teleta, 183-204, Copyright (2021) with permission from Elsevier. Full text @ Dev. Biol.