
|
Fig. 4
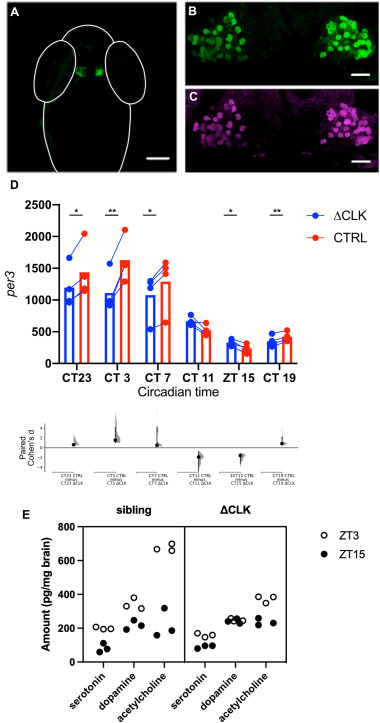
Fig. 4. The effects of expressing truncated clocka in the habenula. (A) Specific expression of EGFP in the habenula of a Tg(gng8:GAL4, UAS:EGFP-Δclocka) fish. (B) At higher magnification, EGFP is visible in the cytoplasm of habenula neurons. (C) Detection of Myc, which is fused to the C-terminus of ΔCLK, in the habenula of transgenic fish. (D) Level of per3 in the habenula of fish with mosaic expression of EGFP-ΔCLK, as determined by qHCR imaging. The lower graph shows Cohen's d, indicating the degree of difference between ΔCLK-expressing and non-expressing cells at each time point. Values are given in the main text. (E) Effects of ΔCLK expression in the habenula on global neuromodulator levels. Plot showing the amount of secreted serotonin, dopamine and acetylcholine in the whole brain of and Tg(gng8:GAL4, UAS:EGFP-Δclocka) and sibling fish (N = 3) at ZT3 and ZT15. Fish with ΔCLK expression in the habenula have a reduced day-night change in levels. Scale bar = 100 μm in panel A, 20 μm in panels B and C; * indicates p < 0.05; ** indicates p < 0.005 by paired t-test. Exact p values are provided in the text.