
Image
|
Figure Caption
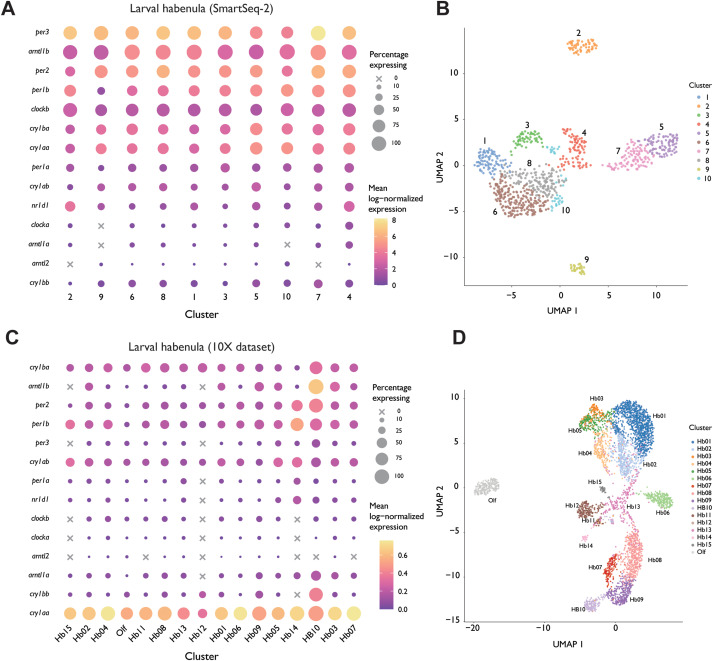
Fig. 1 Fig. 1. Clock genes expression in the zebrafish habenula based on single cell RNA sequencing A) Dot plot showing mean log-normalized expression per cluster and percentage of cells per cluster expressing each gene in the SmartSeq-2 dataset from Pandey et al. B) t-SNE representation of clustering results in the SmartSeq-2 dataset. Each point is a cell. C) same as A) but in the 10X dataset. D) same as C but in the 10X dataset. The cluster assignment for the 10X dataset corresponds to those assigned by Pandey et al., (2018).
Acknowledgments
This image is the copyrighted work of the attributed author or publisher, and
ZFIN has permission only to display this image to its users.
Additional permissions should be obtained from the applicable author or publisher of the image.
Full text @ Neurobiol Stress