
|
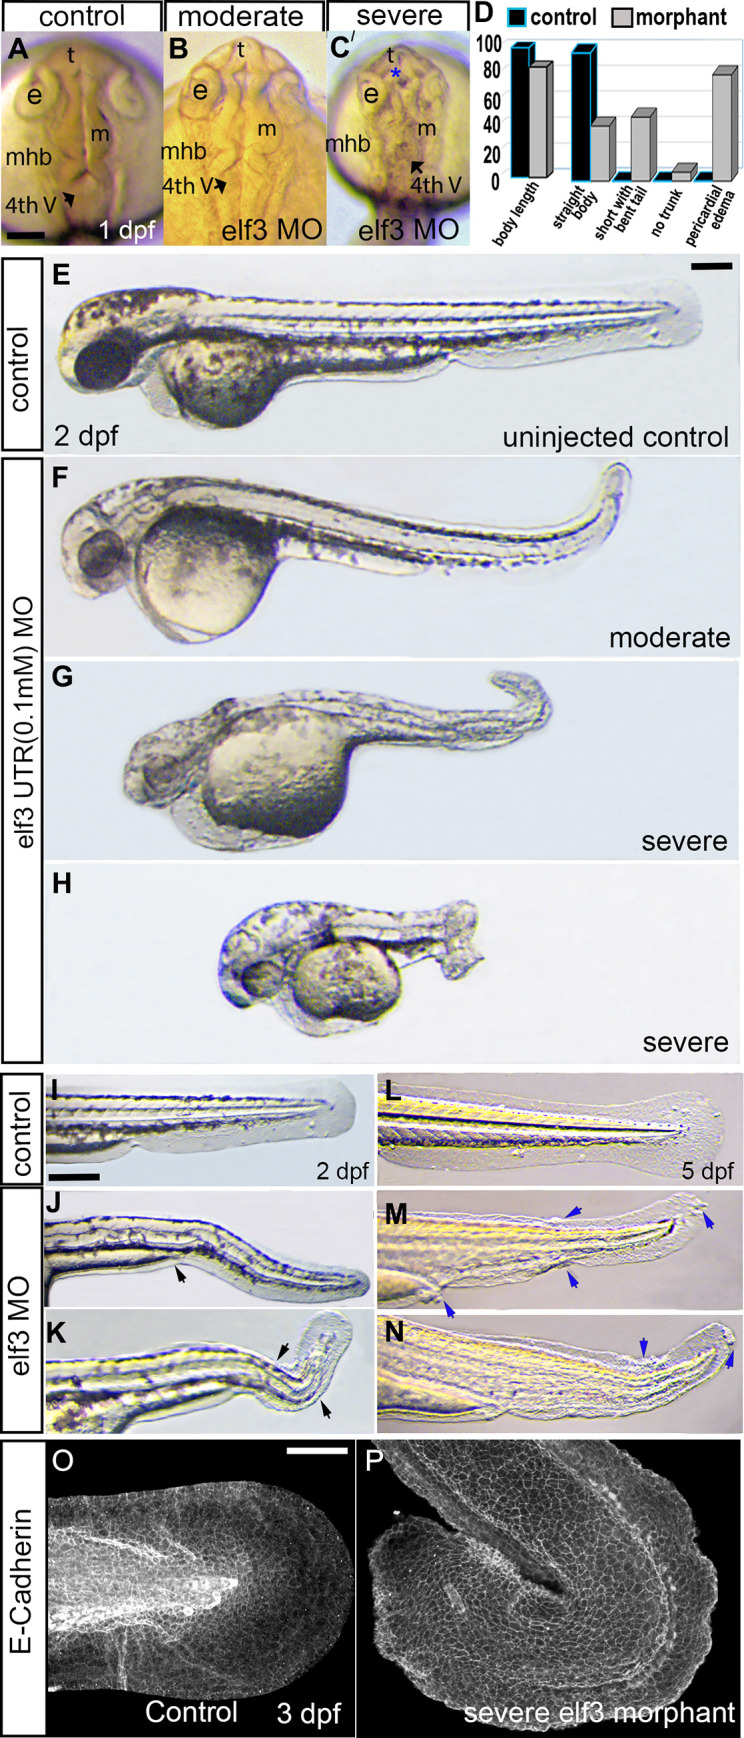
Fig 2
(A-C) Live images of uninjected and elf3 morpholino injected embryos show development of the eye cup, telencephalon (t), forebrain ventricle, mesencephalon (m), midbrain-hindbrain boundary (mhb), and fourth ventricle in 1 dpf control (A) and moderately affected (B) and severely affected (C) embryos. Blue asterisk in C: dead cells. (D) First two bar graphs represent the body length percent of the control (black bar) and the morphant (grey bar) embryos (control embryo:100% ±4.5 (n = 39); elf3-UTR-MO injected embryo: 85.16% ±11.35 (n = 65; p<0.001). Other bar graphs represent the percent of the control and the morphant embryos with the labeled phenotype. (E-H) Live images of 2 dpf uninjected and elf3 morpholino injected embryos show normal morphology of the control embryo (E) and short body, bent tail, small eye, pericardial edema, twisted notochord, and aberrant fin-folds of the morphant embryos (F-H). (I-N) Live images show normal median and caudal fin-fold in control (I, L), and irregular or absence of fin-fold (black arrows) and lumps in the fin fold (blue arrows) in morphants at 2 and 5 dpf. (O, P) 3D reconstruction of the confocal images of the E-cadherin antibody stained larvae show regularly-shaped fin edge of the control larvae and jagged fin-edges of the morphants. Scale bar for A-C; E-H; and I-N = 200 μm. Scale bar for O, P = 100 μm.