
|
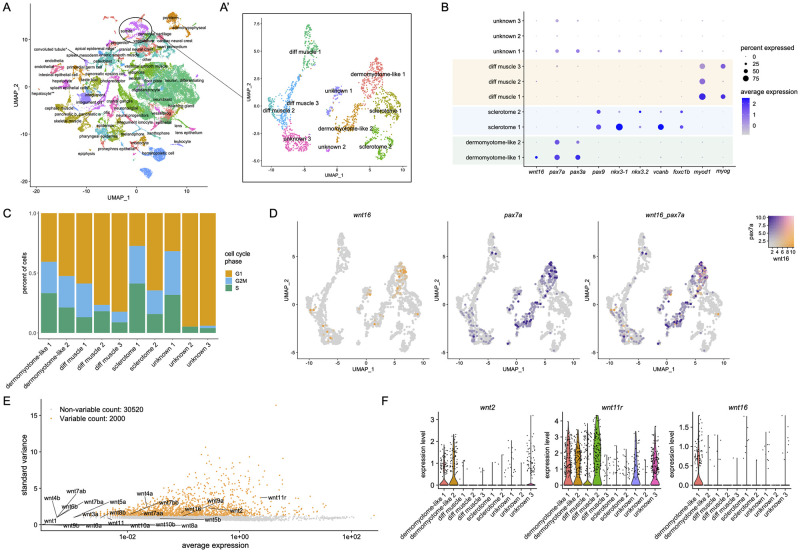
Fig 1
(A) UMAP plot visualizing cell clusters from the sci-RNA-seq analysis of zebrafish embryonic development, as performed by Farnsworth et al., Dev Biol 2020 459:100–108. Circle shows somite cluster used for analysis in this study. (A’) Subclustering of the somite cluster. Of the 10 distinct clusters, 7 could be identified by molecular markers, including two dermomyotome-like populations. (B) Dotplot visualizing expression of genes demarcating the 12 cell clusters. Circle size represents the percentage of cells expressing the gene, and color indicates average gene expression. (C) Percentage of cells in each cell cycle phase. (D) Blend plots for wnt16 and pax7a. (E) Variable features plot for all zebrafish wnt family members. Note that wnt11 (wnt11f1) and wnt11f2 are annotated in the atlas as wnt11r and wnt11, respectively. (F) Violin plots for wnt2, wnt11 (annotated in the atlas as wnt11r), and wnt16.