
|
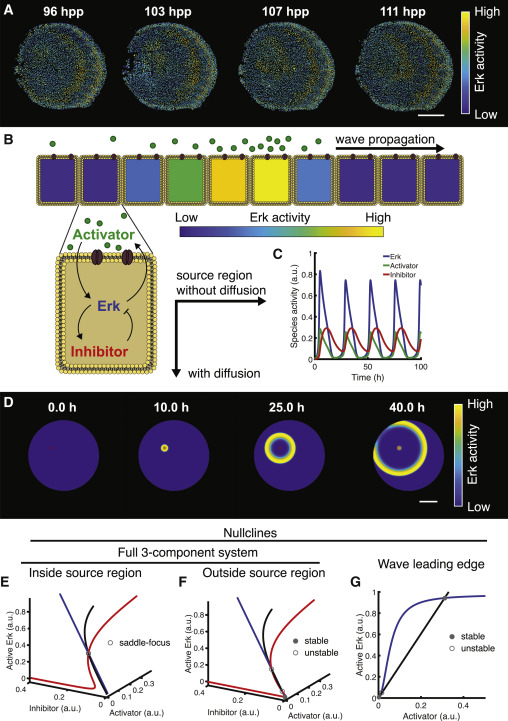
Fig. 1 Figure 1. Model formulation and stability analysis. (A) Erk activity in regenerating scales in vivo, measured using an Erk kinase translocation reporter (Erk KTR). The Erk KTR sensor provides a proxy of Erk activity through measurement of its subcellular localization. The sensor contains both a nuclear localization signal and a nuclear export signal and preferentially localizes to the nucleus when unphosphorylated and to the cytoplasm when phosphorylated (41). Thus, a readout of Erk activity at cellular resolution is calculated by measuring the ratio of nuclear and cytoplasmic Erk KTR signals. The data shown were imaged and analyzed in (35). hpp, hours post plucking. (B) Schematics of theoretical model including a diffusible extracellular activator, Erk, and an inhibitor of Erk. Arrows between chemical species indicate feedback. (C) Numerical simulation of the dynamical system in the source region when diffusion is null. (D) Numerical simulation of the reaction-diffusion dynamical system. (E and F) Stability analysis of the system when diffusion is null. E: source region; F: outside the source region. Curves indicate pairwise intersections between nullcline surfaces. (G) Leading edge fixed-point analysis: nullclines in the leading edge of the wave, where the inhibitor is taken to be 0. Circles: fixed points at 4 h from simulation start (stability is indicated). Scale bars, 250 μm. a.u., arbitrary unit. To see this figure in color, go online.