
|
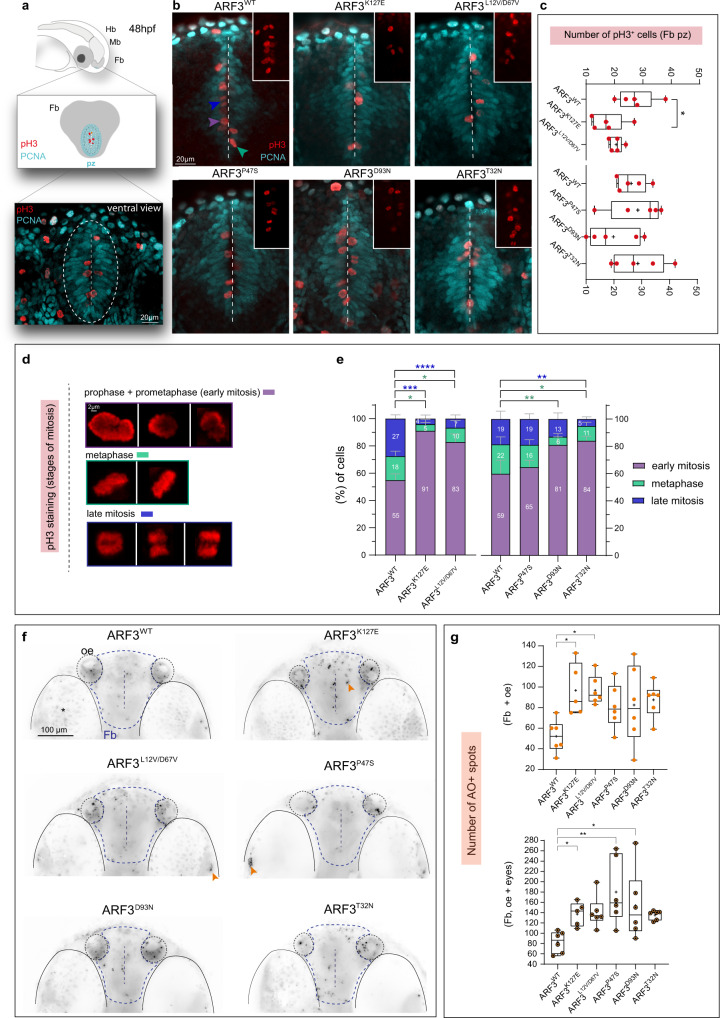
Fig. 9 a Schematics of the forebrain (Fb, gray) proliferative zone (pz, cyan) and a confocal scan of the ventral Fb in zebrafish expressing ARF3WT (dashed white circle) showing proliferative and mitotic cells (PCNA and pH3 staining in red and cyan, respectively). Mb:midbrain, Hb:hindbrain. b Maximum intensity z-projections from a subset of confocal sections showing pH3+ mitotic cells within the ventral Fb (vFb) in zebrafish expressing WT and mutant ARF3. The images are representative of embryos from one batch. Dashed white line indicates the Fb ventricle, insets show zooms on pH3+ cells. Arrowheads indicate examples of pH3+ cells in different stages of mitosis: early mitosis (purple); metaphase (green) and late mitosis (blue). c Quantification of the total number of pH3+ cells in pz, no. of embryos = 5 (WT and K127E, *p = 0.0217) of one batch. Data are expressed as box-and-whisker with median (middle line), 25th–75th percentiles (box), and min-max values (whiskers). All the data points and the mean (“+”) are also shown. d, e Incidence of pH3+ cells in the different mitosis stages. No. of cells = 111 and 110 (WT); 61 (K127E, early mitosis vs. metaphase *p = 0.0168, early vs. late mitosis ***p = 0.0003); 88 (L12V/D67V, early mitosis vs. metaphase *p = 0.0115, early vs. late mitosis ****p < 0.0001); 75 (D93N, early mitosis vs. metaphase **p = 0.0028); 110 (P47S); 109 cells (T32N, early mitosis vs. metaphase *p = 0.0267, early vs. late mitosis **p = 0.0069) from five embryos of one batch. Data are expressed as mean ± SEM. In c and e different datasets for the same measurement are shown in adjacent plots with the internal WT control for each set. f Maximum intensity z-projections of the ventral brain stained with the acridine orange (AO). The black and white images are rendered by inverting the original LUT in Fiji. The images are representative of embryos from two independent batches. Orange arrowheads indicate specific staining. vFb pz, ventricle, eyes, and olfactory epithelium (OE) are outlined for morphological guidance, *indicates eyes with pigmentation background. g Quantification of the number of AO + spots. No. of embryos = 6 (WT); 5 (K127E, *p = 0.0163, *p = 0.0461 for upper and lower graphs, respectively); 6 (L12V/D67V, *p = 0.0109); 6 (P47S, **p = 0.0017 and D93N, *p = 0.0387) of one batch. Data are expressed as box-and-whisker with median (middle line), 25th–75th percentiles (box), and min–max values (whiskers). All the data points and the mean (“+”) are also shown. Two-sided Chi-square’s test in a 2 × 2 contingency table (e), One-way ANOVA followed by Dunnett’s (c and g, upper graph) or Kruskal–Wallis followed by Dunn’s (g, lower graph) post hoc tests are used to assess statistical significance. Source dData are provided as a source data file.