
|
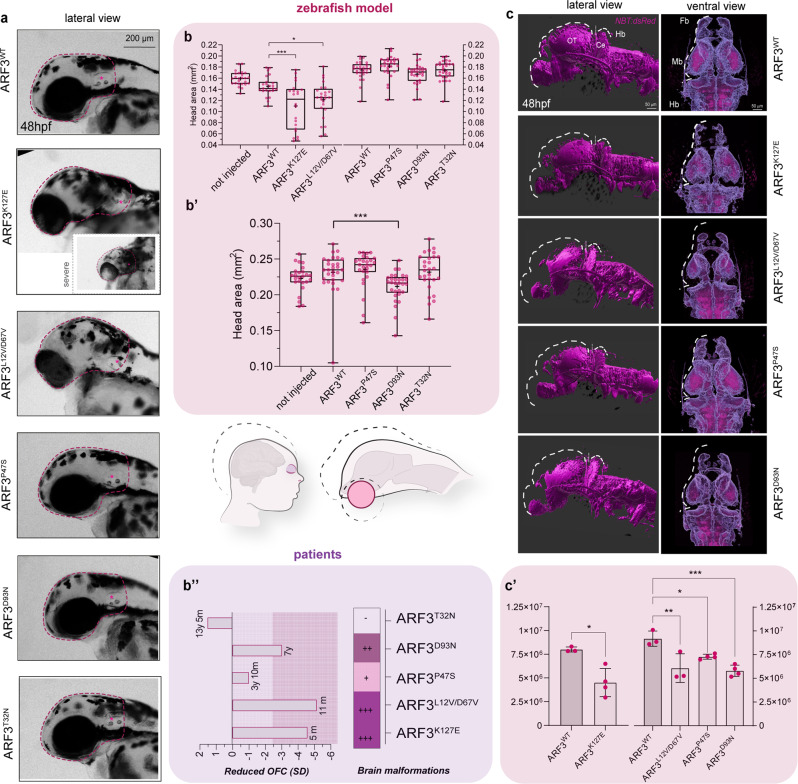
Fig. 8 a Bright-field images of the head (purple dashed line) in fish expressing WT and mutant ARF3 at 48 hpf (the inset for ARF3K127E documents a severe case). The images are representative of embryos from two independent batches. b–b’ Head area quantification at 48 hpf (b) and 4.5 dpf (b’). In b, set 1: no. of embryos = 25 (not injected), 23 (WT); 22 (K127E, ***p = 0.0002) and 25 (L12V/D67V, *p = 0.0106) of one batch; set 2: no. of embryos = 29 (WT); 28 (P47S); 30 (D93N); 29 (T32N). in b’, no. of embryos = 30 (not injected); 30 (WT); 27 (P47S); 30 (D93N, ***p = 0.0006) and 28 (T32N) of one batch. Data are expressed as box-and-whisker with median (middle line), 25th–75th percentiles (box), and min–max values (whiskers). All the data points and the mean (“+”) are also shown. b” Schematics of the brain volume reduction in human patients harboring a subset of ARF3 mutants and in zebrafish models generated in this study. The human brain in the illustration was created with BioRender.com and modified using Illustrator (Adobe). A summary of OFC and brain malformations data from patients in this study are depicted below (no sign of brain malformation (−), mild (+), moderate (++), and severe (+++) malformations). (c) Volumetric reconstructions (c) and anterior brain volume (white dashed line) from live confocal acquisitions from whole brains of 48hpf Tg(NBT:dsRed) fish injected with mRNA encoding WT and ARF3 mutants. The images are representative of embryos from two independent batches for WT, K127E, and L12V/D67V and from one batch for the other mutants. OT: optic tectum, Ce: cerebellum, Fb: forebrain, Mb: midbrain, Hb: hindbrain. c’ Quantification of the brain volume. Set 1: no. of embryos = 4 (WT); 4 (K127E, *p = 0.0163) from one batch; set 2: no. of embryos = 3 (WT); 3 (L12V/D67V, **p = 0.0029); 4 (P47S, *p = 0.0350 and D93N, ***p = 0.0010) of one batch. Data are expressed as mean ± SEM. Different datasets for the same measurement are shown in adjacent plots with the internal WT control for each set, not injected controls between batches are not significantly different. One-way ANOVA followed by Dunnett’s multiple comparison post hoc test (b, left panel; c’, right panel), Krustal–Wallis followed by Dunn’s multiple comparison post hoc test (b, right panel; b’), unpaired t-test with Welch’s correction (c’, left panel) are used to assess statistical significance. Source data are provided as a Source data file.