
Image
|
Figure Caption
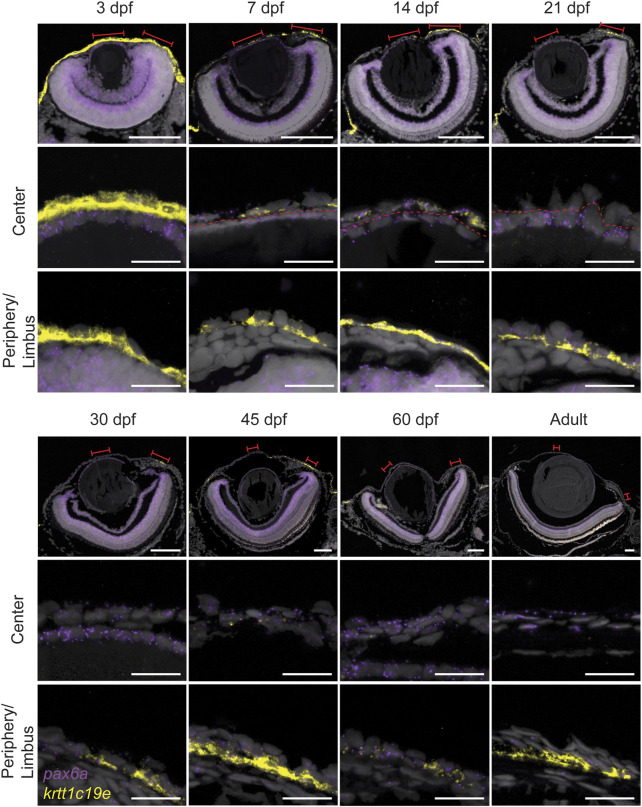
FIGURE 9 Expression of pax6a (red) and krtt1c19e (yellow) during corneal maturation. RNAScope in situ hybridization on 5- µm sections, red lines indicate areas in magnified images in center and periphery. Dashed line indicates the border between lens epithelium and cornea. 3 samples were checked per age group. Scale bars: 100 µm in the overview images, 20 µm in the magnified views.
Figure Data
Acknowledgments
This image is the copyrighted work of the attributed author or publisher, and
ZFIN has permission only to display this image to its users.
Additional permissions should be obtained from the applicable author or publisher of the image.
Full text @ Front. Physiol.