IMAGE

Figure 2

ID
ZDB-IMAGE-221118-149
Source
Figures for Chen et al., 2022
Image
Figure Caption

Figure 2

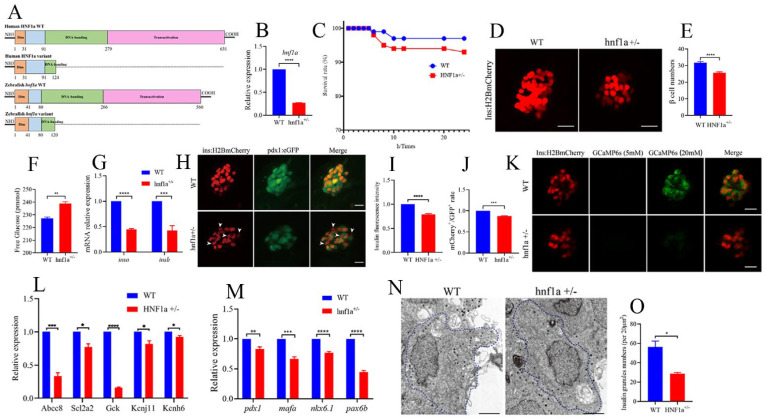
Similar variant impaired β-cell function in zebrafish. (A) Schematic representation of a similar HNF1a-Q125ter variant in zebrafish generated by CRISPR/Cas9. Mutation was caused via a two-base-pair deletion at the CRISPR target site for HNF1a. (B) The transcription level of hnf1a in WT and hnf1a+/−; n = 50 larvae for each genotype. (C) Survival curves of WT and hnf1a+/− zebrafish from 0 h to 24 h. (D,E) Representative confocal images (D) and quantification (E) of the β-cell number from Tg(−1.2ins:H2BmCherry) and hnf1a+/−; Tg(−1.2ins:H2BmCherry) zebrafish larvae. Scale bar indicates 25 μm; n = 20–35 larvae for each genotype. (F) Total free glucose level of WT and hnf1a+/− larvae at 6 dpf. (G) qRT-PCR analysis of the expression of insa and insb mRNA levels in WT and hnf1a+/− larvae at 6 dpf. (H) Representative confocal images of Tg(ins:H2BmCherry); Tg(pdx1:GFP) at 6 dpf for WT and hnf1a+/−. β-cells expressed insulin (mCherry+) without pdx1 (GFP) are shown by white arrows. Scale bar: 10 μm. (I) Quantification of fluorescence intensity for insulin in WT and hnf1a+/−. (J) Quantification of double-positive cells’ (mCherry+/GFP+) rate in WT and hnf1a+/− larvae at 6 dpf; n = 3 larvae for each genotype. (K) Representative images of GCaMP6s response in β cells of Tg(Ins:H2BmCherry); Tg(Ins:GCaMP6s) and hnf1a−/−; Tg(Ins:H2BmCherry); Tg(Ins:GCaMP6s) by 5 or 20 mM glucose ECS solution; the green signal is GCaMP6s. Scale bar: 10 μm. (L) RT-qPCR quantification of mRNA levels for insulin-secretion markers in WT and hnf1a+/− larvae at 6 dpf: abcc8, scl2a2, gck, kcnj11, and kcnh6. (M) RT-qPCR quantification of mRNA levels for β-cell maturation and differentiation markers in WT and hnf1a+/− larvae at 6 dpf: mafa, pdx1, nkx6.1, and pax6b. (N,O) Representative electron micrographs of β cells (N) and quantification of insulin granules (O) in β cells from WT and hnf1a+/− larvae at 6 dpf. (N,O) Transmission electron microscopy for insulin granules. Islet isolation from WT and hnf1a+/− larvae at 6 dpf. The dotted blue lines represent intact individual β cells. Bar scale: 2 μm. n = 3 intact individual β cells for each genotype. Results are represented as means with standard errors; * p < 0.05, ** p < 0.01, *** p < 0.001, and **** p < 0.0001. Student’s t-test. All experiments were performed at least three times, unless otherwise indicated. WT, wild type.

Acknowledgments
This image is the copyrighted work of the attributed author or publisher, and ZFIN has permission only to display this image to its users. Additional permissions should be obtained from the applicable author or publisher of the image. Full text @ Int. J. Mol. Sci.