
|
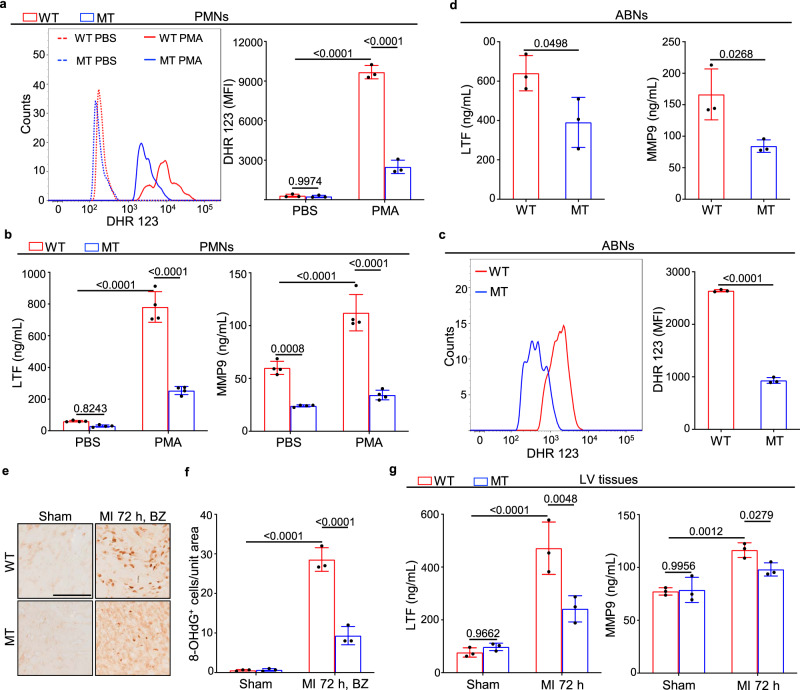
Fig. 5 a Dihydrorhodamine 123 (DHR 123) staining, flow cytometry and corresponding quantitative analysis of ROS levels in WT and Dusp6-deficient PMNs with either PBS or PMA stimulation (n = 3 biological independent samples/group). b ELISA analysis of LTF and MMP9 release in WT and Dusp6-deficient PMNs with either PBS or PMA stimulation (n = 4 biological independent samples/group). c, d DHR 123 staining assays of ROS production (n = 3 biological independent samples/group), and ELISA analysis of LTF and MMP9 release (n = 3 biological independent samples/group) in WT and Dusp6-deficient ABNs. Gating strategies for peripheral and abdominal neutrophils are shown in Supplementary Fig. 4b. e, f Representative immunohistochemistry images and corresponding quantitative analysis of 8-OHdG staining in WT and Dusp6-deficient LV tissue from sham-operated or 72 h after MI (n = 9 areas from 3 hearts/group; scale bar, 100 μm; BZ, infarct border zone). g ELISA analysis of the levels of LTF and MMP9 in WT and Dusp6-deficient LV tissue from sham or 72 h after MI (n = 3 biological independent samples/group). All quantitative data shown in this figure are presented as mean values ± SD. One-way ANOVA with Tukey’s multiple comparison test (for a, b, f and g) and Two-sided unpaired T-test (for c and d) were used to calculate the presented p-values. Source data of a–d, f and g are provided in a Source Data File. WT wild-type, MT Dusp6 mutant, PMA phorbol-12-myristate-13-acetate, DHR 123 dihydrorhodamine 123, LTF lactoferrin, MMP9 matrix metallopeptidase 9, ABNs abdominal neutrophils, 8-OHdG 8-hydroxy-2′-deoxyguanosine.