
|
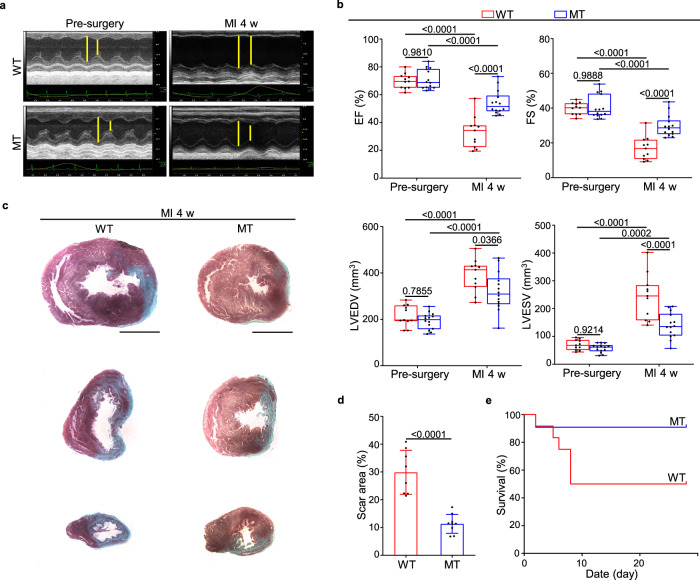
Fig. 1 a Representative echocardiographic images from WT (n = 11) and Dusp6-deficient rats (n = 14) before surgery and 4 weeks (4 w) after myocardial infarction (MI). b Measurement of cardiac function indexes EF and FS as well as the left ventricular dilatation indexes LVEDV and LVESV from echocardiographic results as in a. The box blots show center lines as median, box boundaries as upper and lower quartiles, and whiskers as minimum and maximum values. Masson staining of heart sections (c) and quantitative analysis (d) of the fibrotic area from WT (n = 8) and Dusp6-deficient hearts (n = 8) at 4w after MI. Scale bars: 5 mm. e Kaplan–Meier survival curves of WT (n = 11) and Dusp6-deficient rats (n = 12) at 4w after MI. Quantitative data are presented as min to max with all points mean in b, and as values ± SD in d and e. One-way ANOVA with Tukey’s multiple comparison test (for b) and Two-sided unpaired T-test (for d) were used to calculate the presented p-values. Source data of b, d and e are provided in a Source Data File. MI myocardial infarction, WT wild-type, MT Dusp6 mutant, EF ejection fraction, FS fractional shortening, LVEDV left ventricular end-diastolic volume, LVESV left ventricular end-systolic volume.