
|
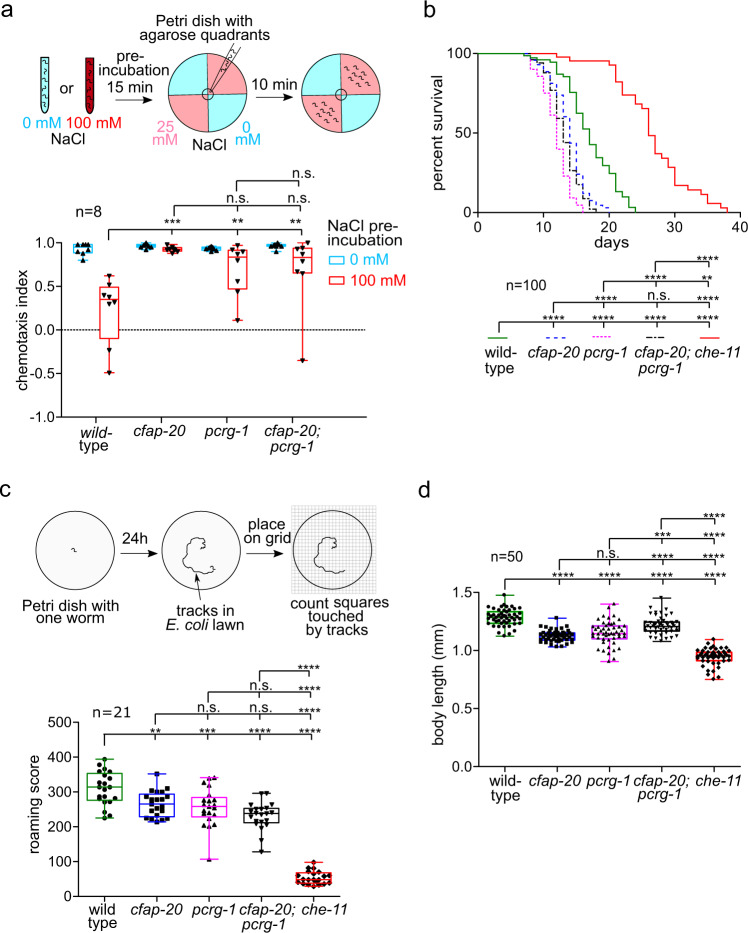
Fig. 4
a C. elegans cfap-20 and pcrg-1 single and double mutants show defects in gustatory plasticity. Wild-type animals pre-exposed to a high NaCl concentration (100 mM) display a reduced attraction to NaCl in chemotaxis assays involving 0 mM and 25 mM NaCl quadrant plates. After exposure to high-NaCl conditions, cfap-20 and pcrg-1 single and double mutants still have significantly increased attraction to NaCl compared to wild-type (one-way ANOVA and Bonferroni test P values: WT vs cfap-20 = 0.005; WT vs. pcrg-1 = 0.0001; WT vs cfap-20;pcrg-1 = 0.006; cfap-20 vs pcrg-1 = 0.9999; cfap-20 vs cfap-20;pcrg-1 = 0.9999; pcrg-1 vs cfap-20;pcrg-1 = 0.9318). b C. elegans cfap-20 and pcrg-1 single and double mutants have reduced lifespans. Staged animals are cultured on plates at 20 °C and monitored every 1–2 days for signs of life. Animals with impaired intraflagellar transport and/or prominent cilia structure defects, such as the che-11 control mutant shown, exhibit an enhanced lifespan. The cfap-20 single and double mutants (with pcrg-1) undergo a statistically-significant reduction in longevity (Log rank Mantle-Cox test; P values: WT vs cfap-20 = 0.0001; WT vs pcrg-1 = 0.0001; WT vs cfap-20;pcrg-1 = 0.0001; WT vs che-11 = 0.0001; cfap-20 vs pcrg-1 = 0.0001; cfap-20 vs cfap-20;pcrg-1 = 0.0755; cfap-20 vs che-11 = 0.0001; pcrg-1 vs cfap-20;pcrg-1 = 0.0024; pcrg-1 vs che-11 = 0.0001; cfap-20;pcrg-1 vs che-11 = 0.0001). c C. elegans cfap-20 and pcrg-1 single and double mutants exhibit a reduced locomotion (roaming defect) common in cilia mutants. The tracks of individual animals are scored with the help of a grid after 24 h. The che-11 mutant, which has IFT defects and major cilia structure anomalies, is shown together with wild-type as a control (one-way ANOVA and Tukey’s test; P values: WT vs cfap-20 = 0.0066; WT vs pcrg-1 = 0.0005; WT vs cfap-20;pcrg-1 = 0.0001; WT vs che-11 = 0.0001; cfap-20 vs pcrg-1 = 0.9426; cfap-20 vs cfap-20;pcrg-1 = 0.0532; cfap-20 vs che-11 = 0.0001; pcrg-1 vs cfap-20;pcrg-1 = 0.2742; pcrg-1 vs che-11 = 0.0001; cfap-20;pcrg-1 vs che-11 = 0.0001). d C. elegans cfap-20 and pcrg-1 single and double mutants have small body sizes (one-way ANOVA and Tukey’s test; P values: WT vs cfap-20 = 0.0001; WT vs pcrg-1 = 0.0001; WT vs cfap-20;pcrg-1 = 0.0001; WT vs che-11 = 0.0001; cfap-20 vs pcrg-1 = 0.4094; cfap-20 vs cfap-20;pcrg-1 = 0.0001; cfap-20 vs che-11 = 0.0001; pcrg-1 vs cfap-20;pcrg-1 = 0.0001; pcrg-1 vs. che-11 = 0.0001; cfap-20;pcrg-1 vs che-11 = 0.0001). The body lengths of staged animals were measured at young adulthood (72 h). All box plots represent minima, 25th percentile, median, 75th percentile, maxima Source data are provided as a Source Data file.