
|
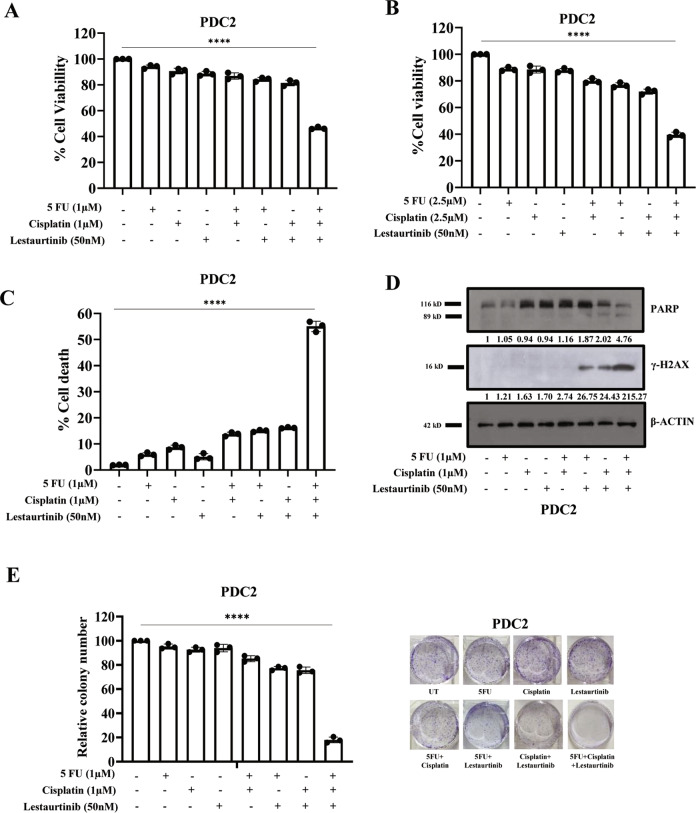
Fig. 7
A, B PDC2 cells were treated with indicated concentrations of cisplatin, 5FU and lestaurtinib for 48 h and cell viability was measured by MTT assay (n = 3 and, ****P < 0.0001 by 2-way ANOVA). C PDC2 cells were treated with indicated concentrations of cisplatin, 5FU and lestaurtinib for 48 h after which cell death was determined by annexin V/7AAD assay using flow cytometer. Bar diagrams indicate the percentage of cell death (early and late apoptotic) with respective treated groups (Mean ± SEM, n = 3 by Two-way ANOVA, ****P < 0.0001). D PDC2 cells were treated with indicated concentrations of cisplatin, 5FU and lestaurtinib for 48 h and immunoblotting (n = 3) was performed with indicated antibodies. E PDC2 cells were treated with indicated concentrations of cisplatin, 5FU, lestaurtinib for 12 days and colony forming assays were performed as described in method section. Left panel: Bar diagram indicate the relative colony number (n = 3 and, ****P < 0.0001 by 2-way ANOVA). Right panel: representative photographs of colony forming assay in each group.