
Fig 5
- ID
- ZDB-IMAGE-221105-13
- Publication
- Bruckner et al., 2022 - The microbiota promotes social behavior by modulating microglial remodeling of forebrain neurons
- All Figures
- Figures for Bruckner et al., 2022
|
Fig 5
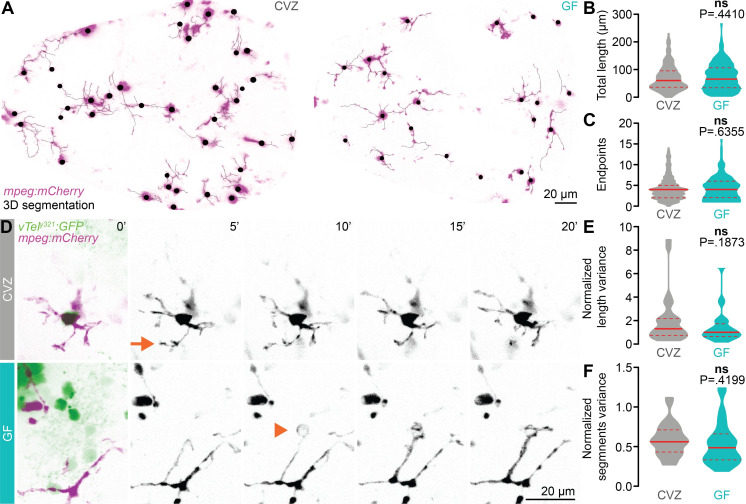
(A) Maximum-intensity Z-projections of representative mpeg1:mCherryTg-positive microglia (magenta), segmented in 3D for morphological quantification (black), from CVZ (left) and GF (right) larvae. The mpeg1:mCherryTg channel is masked using a brightfield image to remove macrophages from the analysis. (B, C) Total microglial length (B) and number of endpoints (C) are similar in GF larvae and CVZ siblings (n = 295 microglia from 8 CVZ larvae 204 microglia from 8 GF larvae; Mann–Whitney U tests). (D) Maximum-intensity Z-projections of representative mpeg1:mCherryTg-positive microglia (magenta) and vTely321 neurons (green), from CVZ (gray) and GF (aqua) larvae, every 5 minutes across a 20-minute time series. Arrow indicates a rapidly retracting protrusion, and arrowhead indicates an extending protrusion that likely envelops an unlabeled neuronal soma. (E, F) Mean-normalized length variance (E) and mean-normalized segments variance (F) of vTely321-embedded microglia across the time series are similar in GF larvae and CVZ siblings (n = 28 microglia from 4 CVZ larvae and 28 microglia from 3 GF larvae; unpaired t test for mean-normalized segments variance; Mann–Whitney U test for mean-normalized length variance). Solid lines represent the mean; dotted lines represent SEM. ns, not significant. Solid red line represents the median; dotted red lines represent the upper and lower quartiles. Data underlying this figure are available on figshare: https://figshare.com/projects/Bruckner_et_al_Data/136756.