IMAGE

Figure 6

ID
ZDB-IMAGE-221031-162
Source
Figures for He et al., 2022
Image
Figure Caption

Figure 6

Biodistribution of LNP and siRNA in zebrafish embryos at tissue-level view. (
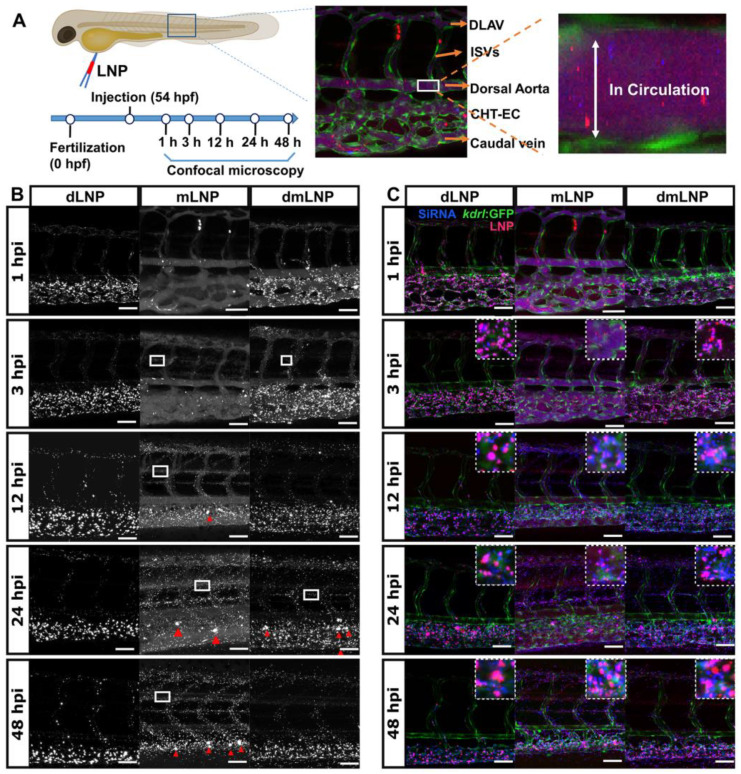
A) Schematic diagram of zebrafish microinjection. First, 1 nL of Dil-labeled LNP was injected into the duct of Cuvier of 54 hpf zebrafish embryos, and confocal images were taken at 1, 3, 12, 24 and 48 h after injection. Tissue-level images of LNP distribution in Tg (kdrl:eGFP) embryos were shown with the white boxes indicating LNP in the circulation. CHT-EC: caudal hematopoietic tissue endothelial cells, DLAV: dorsal longitudinal anastomotic vessel. ISV: intersegmental vessel. (B) The bright-field images of LNP biodistribution at multiple hpi (s). Macrophage-uptake of LNP is marked with red triangles, and extravasation of LNP is indicated by white rectangles. (C) The fluorescence images of the biodistribution of LNP (red) and siRNA (blue) at different time points. The zoomed-in images are displayed in the white squares. Scale bar of (B,C): 200 µm.

Acknowledgments
This image is the copyrighted work of the attributed author or publisher, and ZFIN has permission only to display this image to its users. Additional permissions should be obtained from the applicable author or publisher of the image. Full text @ Pharmaceutics